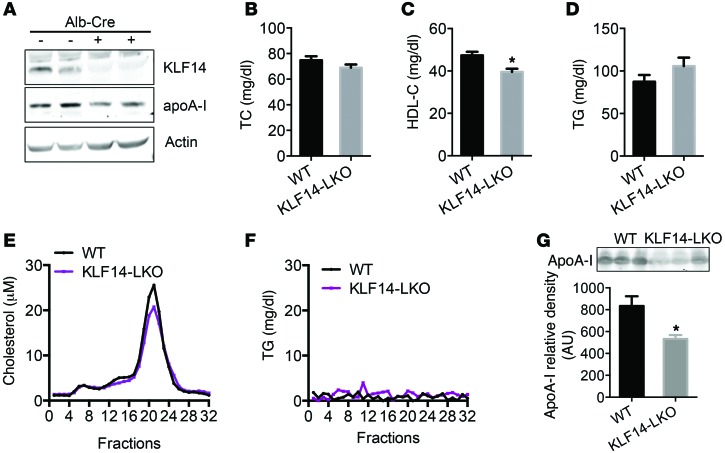
Figure 3. Liver-specific deletion of Klf14 showed decreased HDL-C levels.
(A) Western blot of KLF14 and ApoA-I expression in the livers of KLF14-LKO and littermate control (WT) mice. TC (B), HDL-C (C), and TG (D) levels were determined in KLF14-LKO and littermate control mice fasted overnight (n = 5–7 for each genotype). *P < 0.05, Student’s t test. (E and F) Pooled serum samples from KLF14-LKO and WT mice were assayed by HPLC, and cholesterol and TG levels (fractions 1 to 32) were determined. (G) Representative Western blot and quantifications of ApoA-I levels by Western blot analysis in 1 μl of serum samples from WT and KLF14-LKO mice. Values represent mean ± SEM (5–7 for each genotype). *P < 0.05, Student’s t test.

