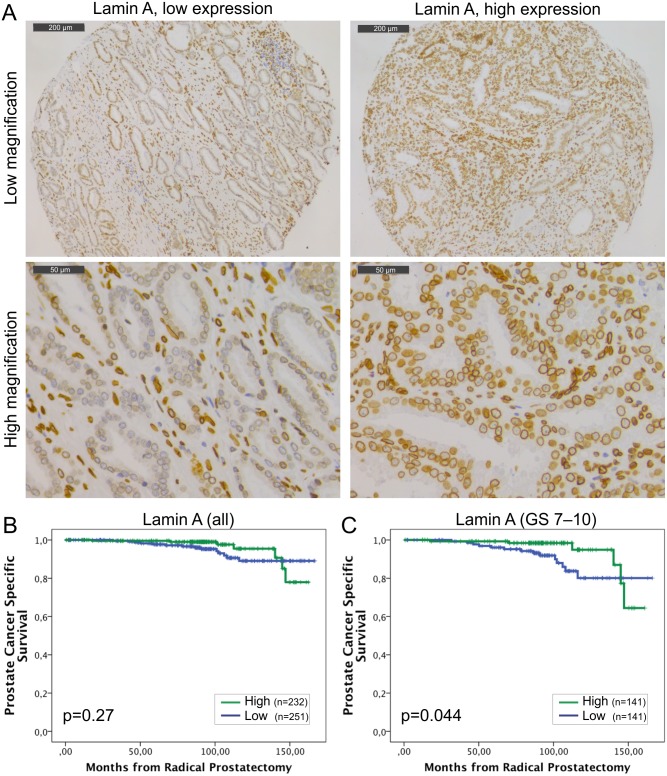
Fig 1. Low lamin A expression in PCa predicts unfavorable DSS.
(A) Representative examples of TMA slides stained for lamin A with immunohistochemistry. Low and high power field images from both low and high expressing tumors are shown. (B-C) Kaplan-Meier analysis shows a trend between low lamin A expression and poor DSS in the entire cohort (B; p = 0.27). However, in the subpopulation of patients with Gleason score >6 tumors, there is statistically significant difference (C; p = 0.044).

