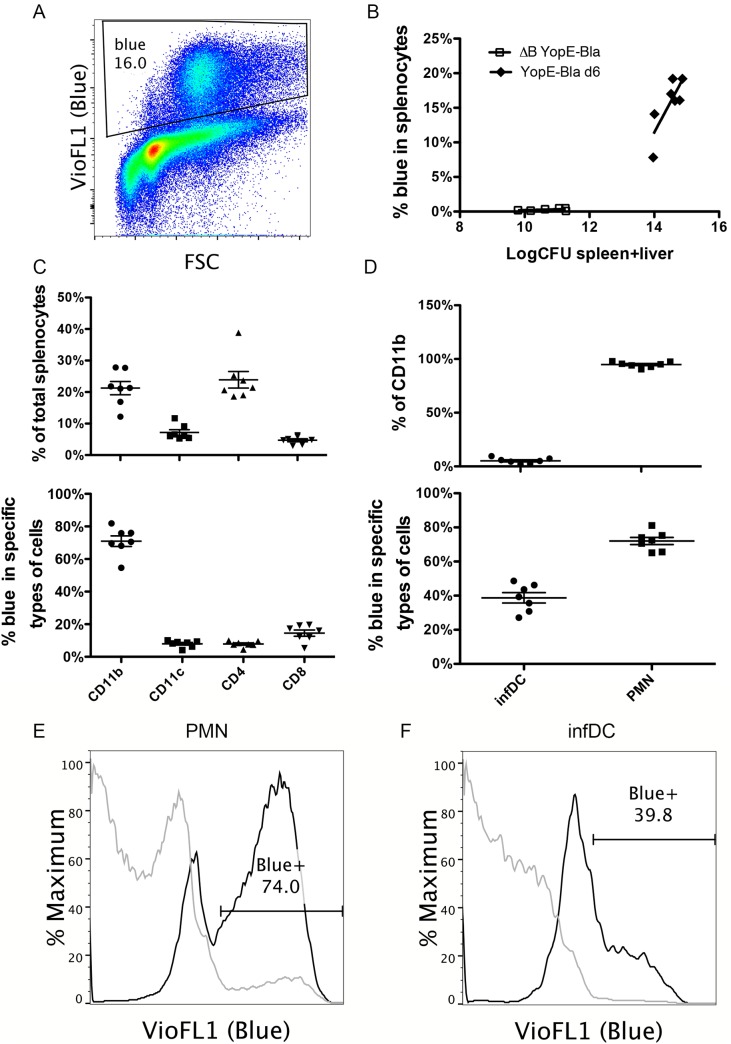
Fig 6. Detection of YopE-TEM1 translocation into different splenocyte populations.
C57BL/6 mice were IV infected with 105 CFU of YopE-Bla or 5X10⁶ CFU of ΔB YopE-Bla for 6 days. Splenocytes isolated from surviving mice were incubated with CCF4-AM to detect the presence of translocated YopE-TEM1, and subsequently stained with a panel of antibodies and analyzed with flow cytometry. (A) A representative histograph of splenocytes from a mouse infected with YopE-Bla showing the gate for translocation positive cells (Blue). (B) Spleen and liver colonization levels were determined by CFU assay for YopE-Bla, and ΔB YopE-Bla and the combined value of spleen and liver colonization was plotted against the percentage of blue splenocytes in the same mice. Data shown are the summary of four independent experiments. (C) Splenocytes from mice infected with YopE-Bla for 6 days were analyzed by flow cytometry and the percentage of splenocytes positive for the indicated markers (top) and blue cells among these cells (bottom) were determined. (D) Percentage of Ly6Chi infDCs or Ly6Cmed PMNs among the CD11b+ splenocytes from mice infected with YopE-Bla for 6 days were determined by flow cytometry (top), and the percentage of blue cells among these were plotted at bottom. Representative histograph of overlaid blue signal strength of PMNs (E) or infDC (F) from an individual mouse infected for 6 days with YopE-Bla (black lines) or ΔB YopE-Bla (light gray lines). The percentage of blue cells from the YopE-Bla-infected sample was indicated in the gate. In B-D, each dot represents the value obtained from one mouse, and wherever applicable, the bar indicated the average.

