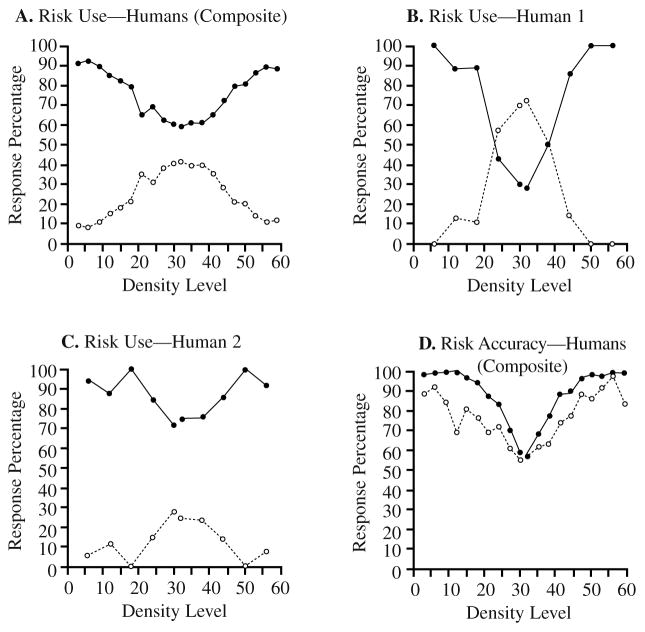
FIGURE 1.
The performance of human participants in the confidence-rating density-discrimination task of Experiment 1A. A. The use of the two risk choices (high- and low-confidence) by 92 humans. In this and all graphs to follow, the x-axis represents density Levels 1 to 61, of which Levels 1 to 30 were designated as sparse trials and Levels 32 to 61 as dense trials. Level 31 was never presented. The filled and open circles show humans’ use of the high-risk and low-risk choices, respectively, for stimuli at different density levels. B. Human 1’s use of the two risk choices (high- and low-confidence) depicted as just described. C. Human 2’s use of the two risk choices. D. The percentage of correct dense–sparse responses at each density level when these responses were followed by high-risk choices (filled circles) or low-risk choices (open circles).

