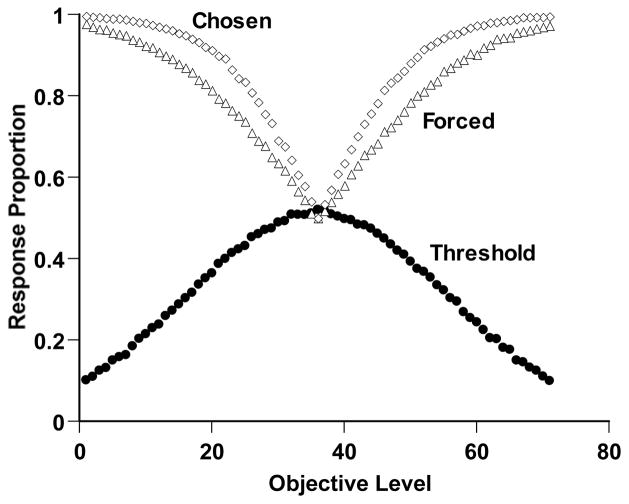
Figure 5.
Temporal-duration discrimination performance by a simulated observer in Simulation 3 that performed as illustrated in Figure 4. Details of the simulation are described in the text. The horizontal axis indicates the objective duration of the trial (Levels 1–35 Short; Levels 37–71 Long). The open diamonds and open triangles, respectively, show the proportion correct the observer achieved when it used the most attractive response from among 3 options (Chosen trials) or 2 options (Forced trials). The filled circles show the proportion of trials on which the response strength for the third response was highest.

