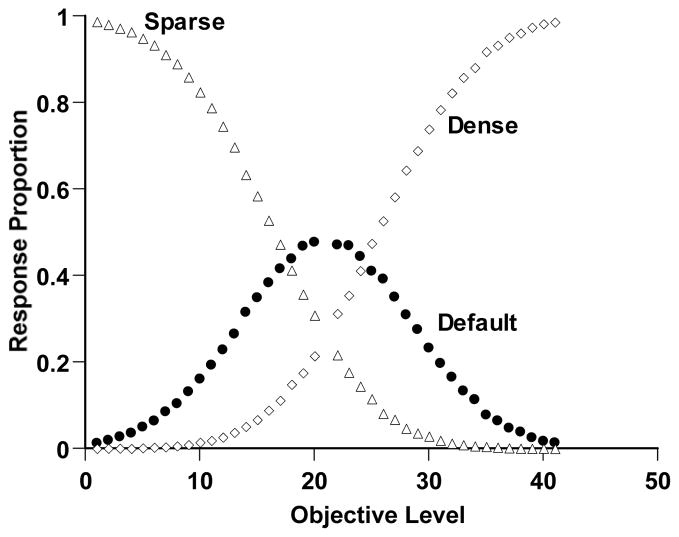
Figure 7.
Density discrimination performance by a simulated observer in Simulation 4 that performed as illustrated in Figure 6. Details of the simulation are described in the text. The horizontal axis indicates the objective density of the trial (Levels 1–20 Sparse; Levels 22–41 Dense). The open triangles and diamonds, respectively, show the proportion of Sparse and Dense responses. The filled circles show the proportional use of the third, aversion-avoidance response.

