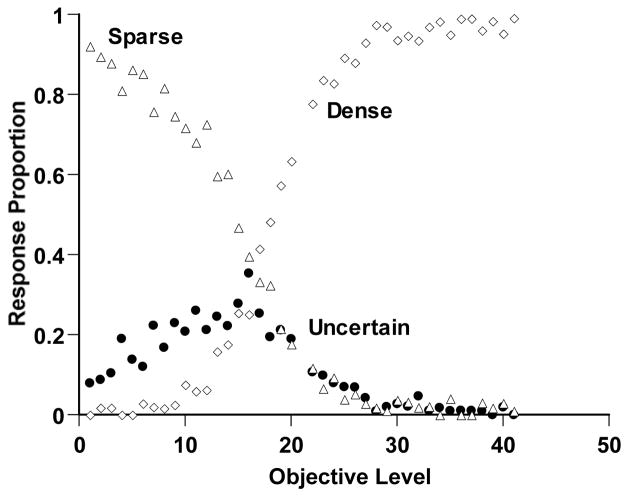
Figure 8.
Sparse-Dense discrimination performance by a monkey in the experiment of Smith et al. (2006). The horizontal axis indicates the objective density of the trial (Levels 1–20 Sparse, Levels 22–41 Dense). The open triangles and diamonds, respectively, show the proportion of Sparse and Dense responses. The filled circles show the proportional use of the uncertainty response for different trial levels.

