Figure 1.

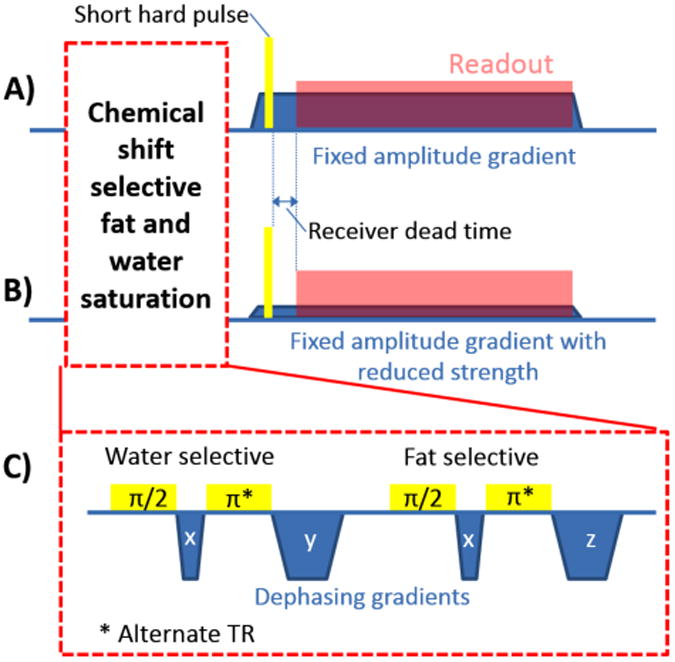
The schematic plot of the WASPI pulse sequences used to acquire (A) the main data set and (B) the second data set for finer sampled k-space centre. (C) The chemical shift selective fat and water saturation.

The schematic plot of the WASPI pulse sequences used to acquire (A) the main data set and (B) the second data set for finer sampled k-space centre. (C) The chemical shift selective fat and water saturation.