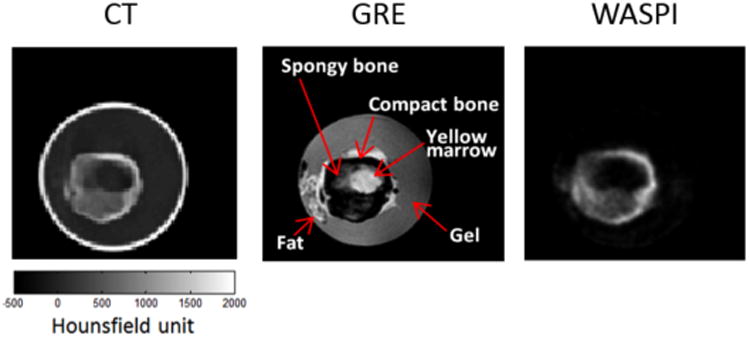
Figure 3.

A transverse slice of the CT volume compared with the corresponding slice acquired using a conventional GRE pulse sequence and WASPI. The signal intensity of the bone in the WASPI sequence is similar to the corresponding CT HU values. Note that the phantom is in a glass container, which has no MR signal but high HU values.
