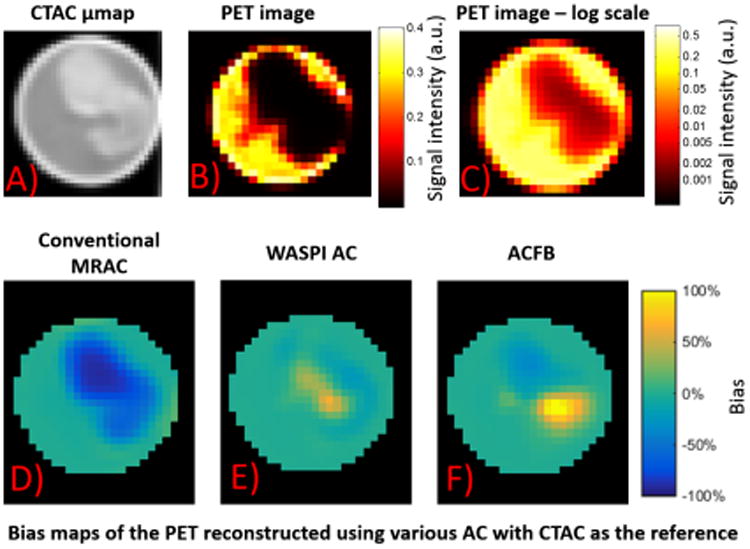
Figure 5.

(A) A transverse slice of the CTAC μ-map of the phantom, and the corresponding PET image with CTAC in (B) linear and (C) log scales. The bias map of the slice of the PET image volumes with (D) conventional MRAC, (E) WASPI AC and (E) ACFB, using the PET image volume reconstructed with CTAC as the reference.
