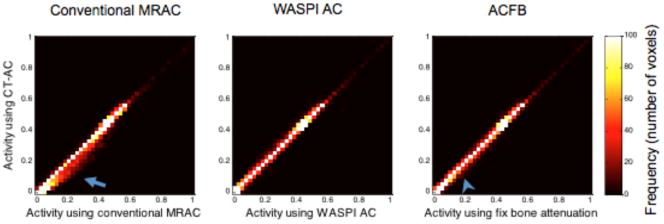
Figure 6.

The joint histograms of the PET activities of all the voxels in the PET image volume reconstructed with conventional MRAC, WASPI AC and ACFB compared to the image volume reconstructed using CTAC. The arrow and arrowhead point to the biased pixels, showing the overestimation caused by conventional MRAC and ACFB.
