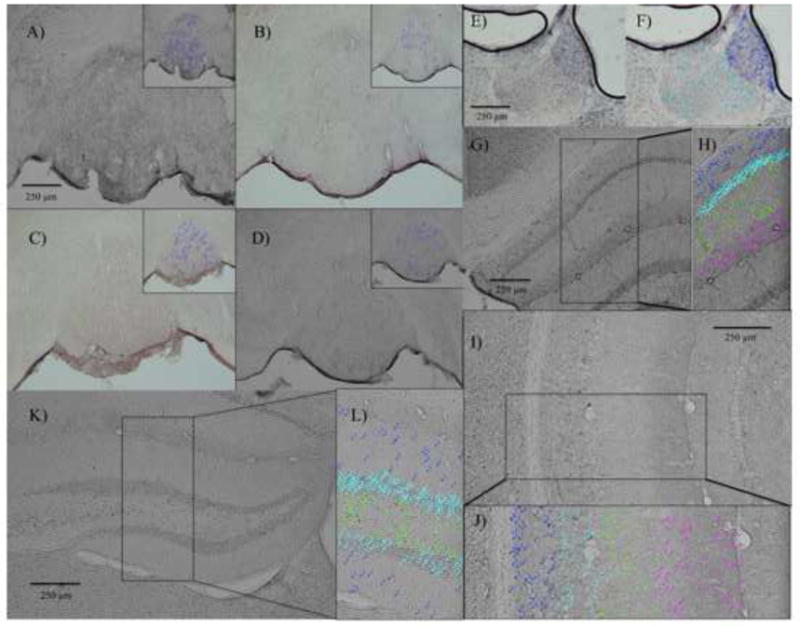
Figure 2. Representative photomicrographs demonstrating cfos staining within midbrain and limbic brain structures.

Cfos staining within the IPN, with inset images showing nuclei that were counted as cfos-positive (wild type, nicotine withdrawal (A), wild type, vehicle-treated (B), knockout, nicotine withdrawal (C) and knockout, vehicle-treated (D)); cfos staining within the MH and LH (E) and the nuclei that were marked as cfos-positive for the MH (dark blue markers) and LH (light blue markers) (F); cfos staining within the CA1 region of the DH (G), and the magnified segment of the same brain section showing the nuclei marked as cfos-positive across all four layers (H); cfos staining within the CA1 region of the VH (I), and the magnified segment of the same brain section showing the nuclei marked as cfos-positive within the four layers (J); cfos staining within the dentate gyrus (K), and the magnified segment of the same brain section showing the nuclei marked as cfos-positive within the three layers (K).
