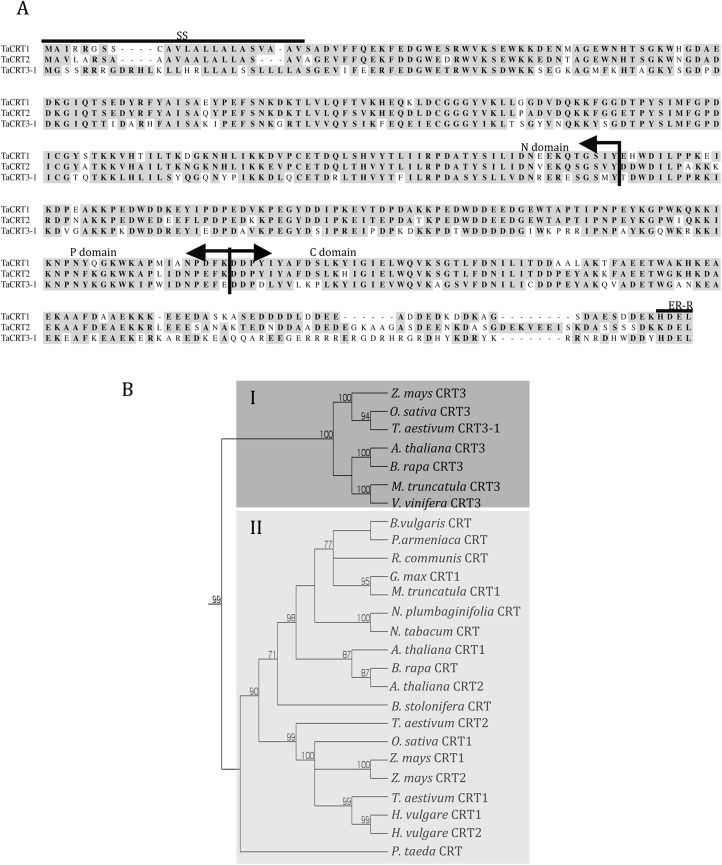
Fig 1. Primary structure comparison among wheat CRT proteins (A) and phylogenetic analysis of plant CRT proteins (B).
Dark shading indicates conserved residues. SS, the ER import signal sequence; ER-R, the ER-retention signal HDEL. The protein sequences used to construct the phylogenetic tree are presented in S4 Table.

