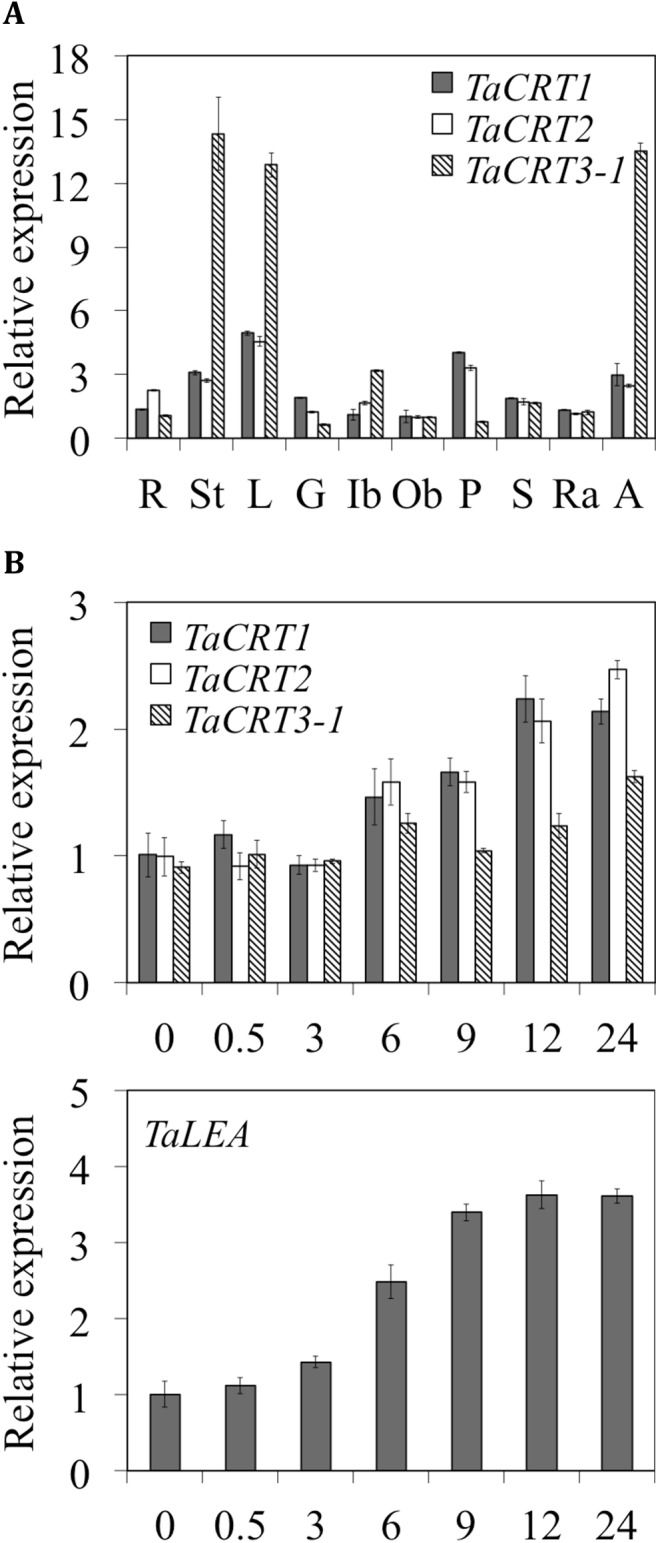
Fig 2. Expression of TaCRT genes and their response to salt stress in wheat.

(A) Expression of TaCRT genes in various wheat tissues collected from field-grown plants at 15 days after anthesis, as measured using quantitative real-time PCR. R, seedling roots; L, leaves; St, spikes; G, glume; Ib and Ob, inner bract and outer bract, respectively; P and S, pistil and stamen, respectively; Ra and A, rachis and awn, respectively. (B) Expression patterns of TaCRT and TaLEA genes in wheat seedling roots after treatment with 250 mM. ‘0’ represents no treatment. Error bars represent the standard deviation of results obtained for three replicate experiments.
