
Fig 6. TaCRT1 segments in transgenic tobacco exhibited greater chlorophyll content.
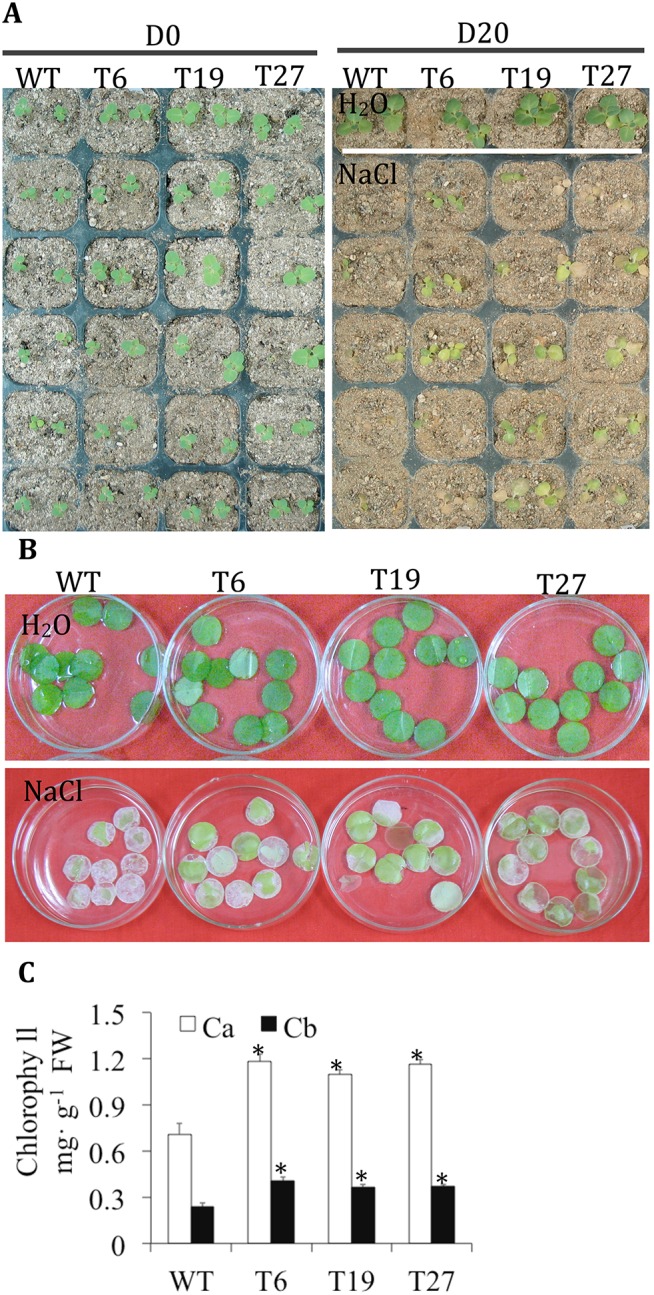
(A) Phenotypes of transgenic tobacco lines under irrigation with 250 mM NaCl every 2 d. (B) Response of leaf discs obtained from WT and transgenic tobacco lines floating on a 400 mM NaCl solution. (C) Chlorophyll content of leaf discs obtained from WT and transgenic tobacco lines. WT represents non-transgenic tobacco; T6, T19 and T27 represent transgenic tobacco lines. D0 represents no treatment, D20 represents NaCl treatment for 20 d; Ca: chlorophyll a; Cb: chlorophyll b. Error bars represent the standard deviation of results obtained for three replicate experiments; asterisks indicate significant differences from WT plants at P = 0.05.