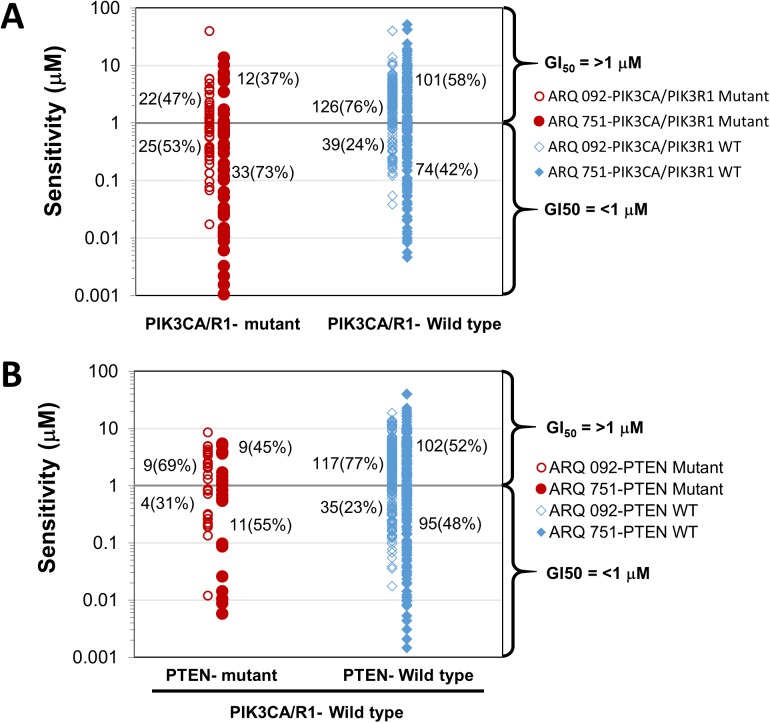
Fig 6. PIK3CA/PIK3R1 mutational status is associated with increased ARQ 092 and ARQ 751 sensitivity.
Somatic mutation analysis was performed for ARQ 092 and ARQ 751 sensitive (GI50<1 μM) and resistant (GI50 ≥1 μM) groups for 212 cancer cell lines. Twenty-eight of 240 cells were excluded due to unavailability of mutation status. (A) Scatter plot shows the correlation between ARQ 092 and ARQ 751sensitivity and PIK3CA/R1 mutations in comparison to WT-PIK3CA/PIK3R1. (B) Scatter plot shows the correlation between ARQ 092 and ARQ 751 sensitivity and PTEN mutations in comparison to WT-PTEN.

