
Fig 2. Receiver operating characteristic (ROC) curve analysis for predicting cardiovascular events.
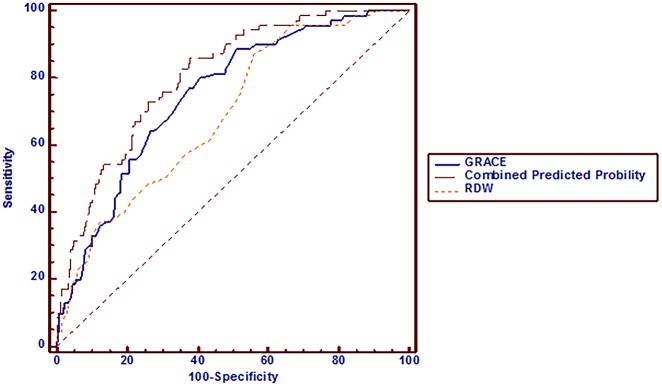
For GRACE score alone, the area under the curve (AUC) was 0.749 (95% CI: 0.707–0.787). When RDW was added to GRACE score, the AUC was 0.805 (95% CI: 0.766–0.839, p = 0.034).