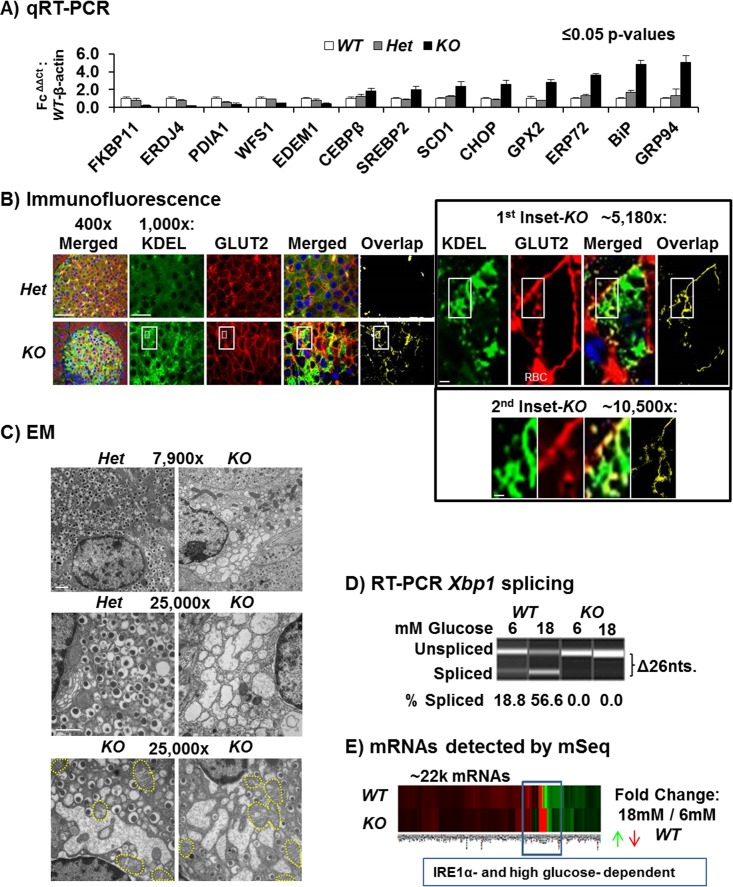
Fig 2. KO islets exhibit ER stress.
(A) qRT-PCR of UPR genes in islets isolated 6 wk post-Tam and incubated in 11 mM glucose 16 h ([n = 5], [p ≤ 0.05]). (B) Immunofluorescence microscopy of pancreas sections stained for KDEL (BIP and GRP94) (green), the plasma membrane protein GLUT2 (red), and nuclei DAPI (blue). Overlap of red/green channels represents defective compartmentalization that was found to be increased in the KO Fe/-; Cre as shown in yellow. Scale bars, 400x = 50 μm, 1,000x = 10 μm, 5,180x = 2 μm and 10,500x = 1 μM. Additional examples are shown in S3B Fig. (C) EM of adult mouse (16 wk old) islets and their β cells from mice 2 wk post-Tam. Scale bars, both panels, 1 μm. Distended mitochondria are outlined with yellow dashes. (D) Conventional PCR flanking the 26 nt intron in Xbp1 mRNA spliced by IRE1α from the islet complementary DNAs (cDNAs) used for mRNA-Seq analysis, 6 mM versus 18 mM glucose. Results representative of n = 5 per genotype. (E) Global heatmap for the ~22,000 mRNAs detected by mRNA-Seq for 18 mM KO Fe/-; Cre & WT Fe/+ samples; green and red indicate increased and decreased expression. The blue box indicates genes with inverse expression dependent on IRE1α and high glucose.

