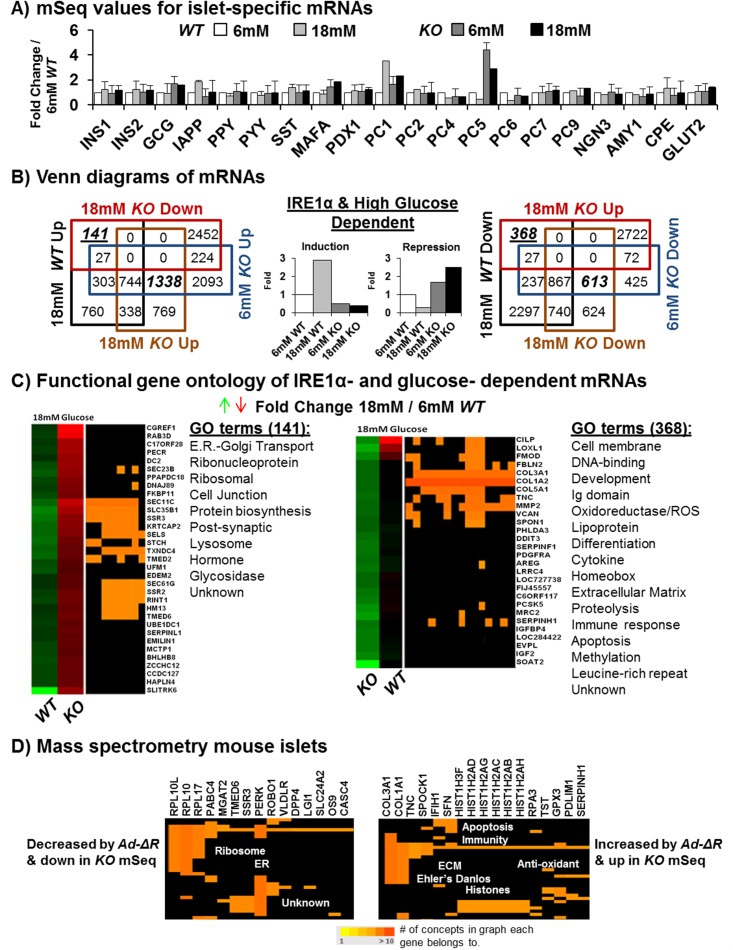
Fig 3. mRNA sequencing identifies IRE1α- and glucose-dependent mRNAs in islets.
(A) mRNA-Seq data on β cell-specific mRNAs. The results show no significant change to INS1 or INS2 in the KO Fe/-; Cre samples, while MAFA, GCG, and PC5 are increased by deletion ([n = 5], [18 mM KO Fe/-; Cre, p-values ≤ 0.05]). mRNA-Seq expression fold changes were normalized relative to the 6 mM WT Fe/+ islet context. (B) Four-way Venn diagrams of WT Fe/+ versus KO Fe/-; Cre islets during 6 mM versus 1 8mM glucose exposure for 72 h. Ire1α-dependent mRNAs are in bold italics, while those also dependent on high glucose are in bold, italicized, and underlined font. At the center, bar graphs representing the Ire1α- and glucose-dependent trends of interest are labeled “Induction” and “Repression.” (C) Combined DAVID (the Database for Annotation, Visualization and Integrated Discovery) and “ConceptGen” GO analysis of Ire1α- and glucose-dependent mRNAs. Categories shown are specifically found in the genotype, while the shared categories have been omitted for simplicity, although no single mRNA was common between the groups. (D) Mass spectrometry of murine islets infected with Ad-IREα-K907A (Ad-ΔR) versus Ad-β-Galactosidase (β-Gal). Proteins with ≥5 unique peptides detected per protein increased or decreased upon infection in triplicate were analyzed for GO using ConceptGen and DAVID web resources (n = 3). The proteins shown (Fig 3D) exhibit the same expression dependence for IRE1α as measured by mRNA-Seq (S2 Data).

