
Fig 9. Transcriptional changes of wax genes in w3 mutant against BW.
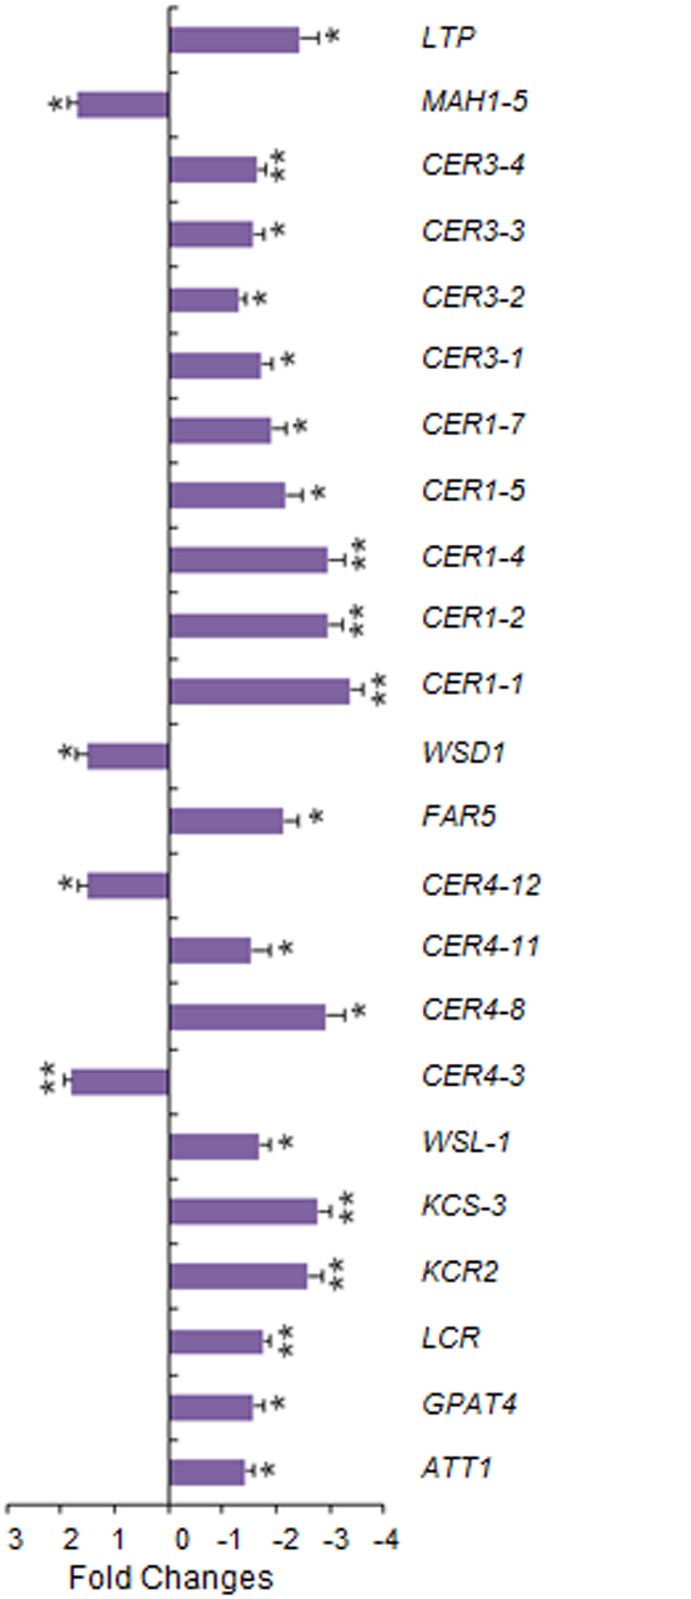
Genes with significant fold changes are depicted. The error bars represent standard deviation of the mean fold-change of mRNA levels calculated from four biological replicates. Asterisks indicate that the difference is significant at P< 0.05 (*) or at P < 0.01 (**). Expression data for all genes analyzed are listed in S2 Table.