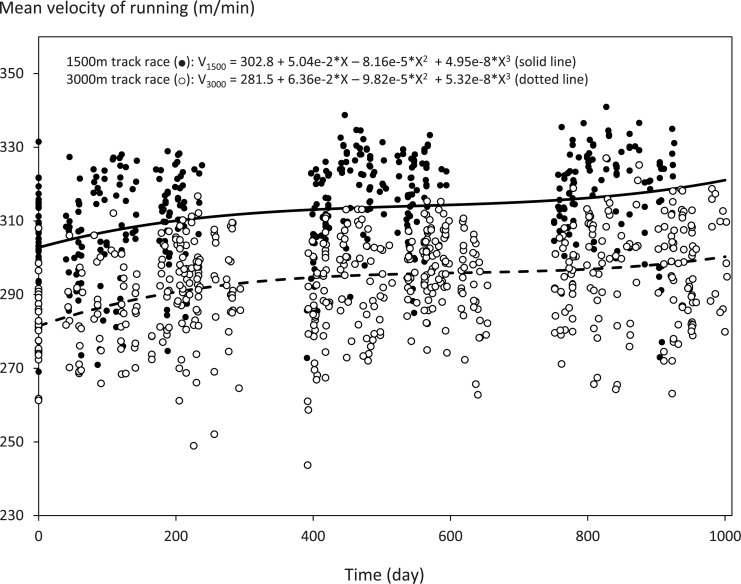
Fig 1. Changes in running velocities for 1500 m and 3000 m races.
The cubic polynomial curves determined by multilevel analysis to best describe the trajectories of running velocities for 1500 m (V1500, solid line) and 3000 m (V3000, dotted line) track races over time among adolescent female distance runners. Closed and open circles represent the records of individual 1500 m and 3000 m races, respectively. X in the model equations denotes Time (day). All unadjusted estimates; p < 0.05 and p < 0.001, respectively.

