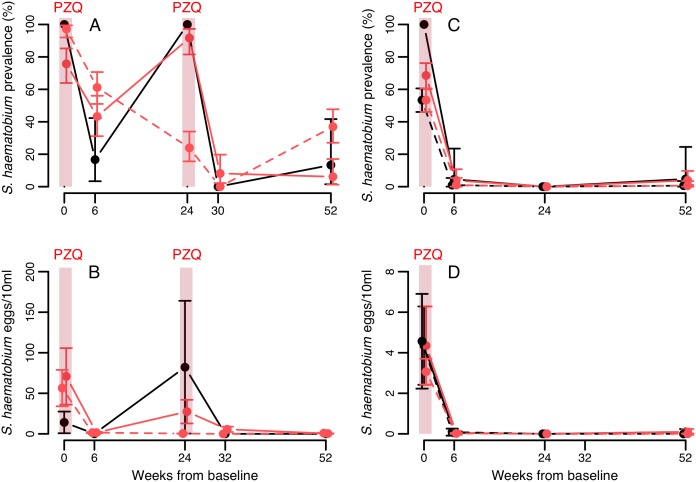
Fig 5. Longitudinal dynamics of S. haematobium in Senegal (A,B) and Niger (C,D), according to co-infection status with S. mansoni at baseline.
Means from raw data are plotted with 95% confidence intervals. Confidence intervals for prevalence are exact, and for intensity data were calculated using a negative binomial GLM on egg counts including zero counts. Black and red lines indicate baseline single infections and co-infections with S. mansoni respectively. Solid and dashed lines represent the villages of Temeye and Nder in A and B, and Diambala and Namarigoungou in C and D respectively. There is no line for single infections in Nder because all infections in that village were co-infections.

