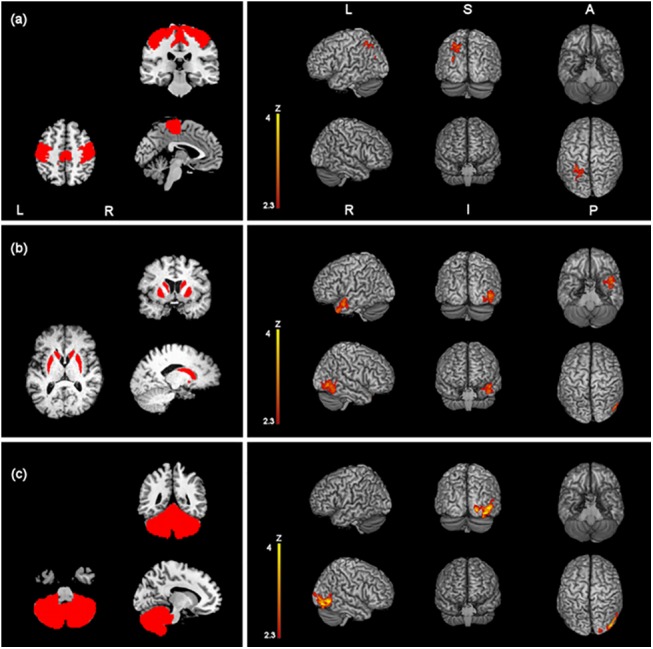
Fig 3. Z-statistic images showing clusters of significantly increased RSFC (p < 0.05, cluster-level FWE corrected) after one session of effective AMPS of the primary sensory motor cortex (a), the nuclei striati (c) and the cerebellum (d), overlaid onto a MNI-registered anatomical 3D-T1 volume.

Seed regions of interest are red-coloured in the panels on the left. MNI coordinates (x, y, z) of the maximal Z-scores are presented in Table 2. Coronal and axial views follow the neurological convention.
