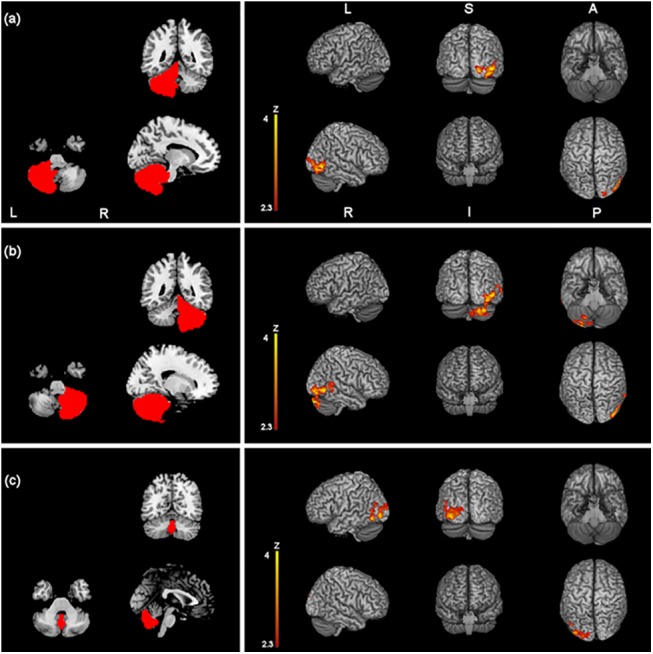
Fig 5. Z-statistic images showing clusters of significantly increased RSFC (p < 0.05, cluster-level FWE corrected) after one session of effective AMPS and in the effective vs. sham stimulation for the right cerebellar hemisphere (a), the left cerebellar hemisphere (b) and the vermis (c). Seed regions of interest are red-coloured in the panels on the left. MNI coordinates (x, y, z) of the maximal Z-scores are presented in Table 4.

Coronal and axial views follow the neurological convention.
