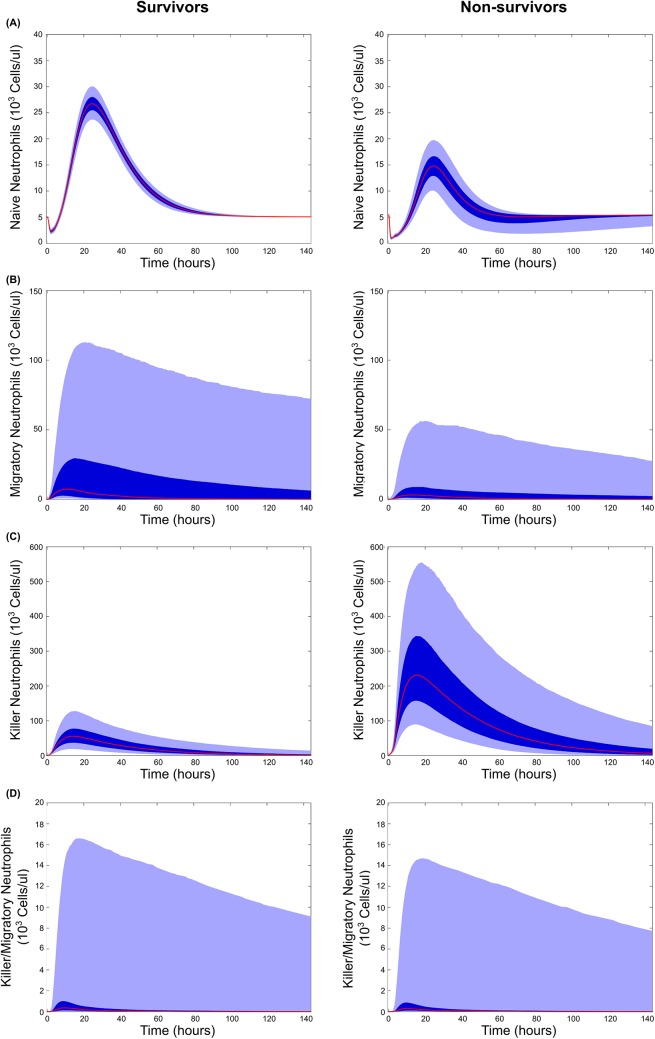
Fig 4. Model predictions for neutrophil phenotype dynamics following infection.
Mean (red), 25th-75th percentile (dark blue), and 5th-95th percentile trajectories of the simulated ensemble are shown. Predictions are shown for surviving (left) and non-surviving (right) animals for the four neutrophil phenotypes considered in the model; (A) basal neutrophils, which were calibrated with white blood cell count data, as well as (B) migratory neutrophils, (C) killer neutrophils, and (D) killer/migratory neutrophils for which there is no experimental data.

