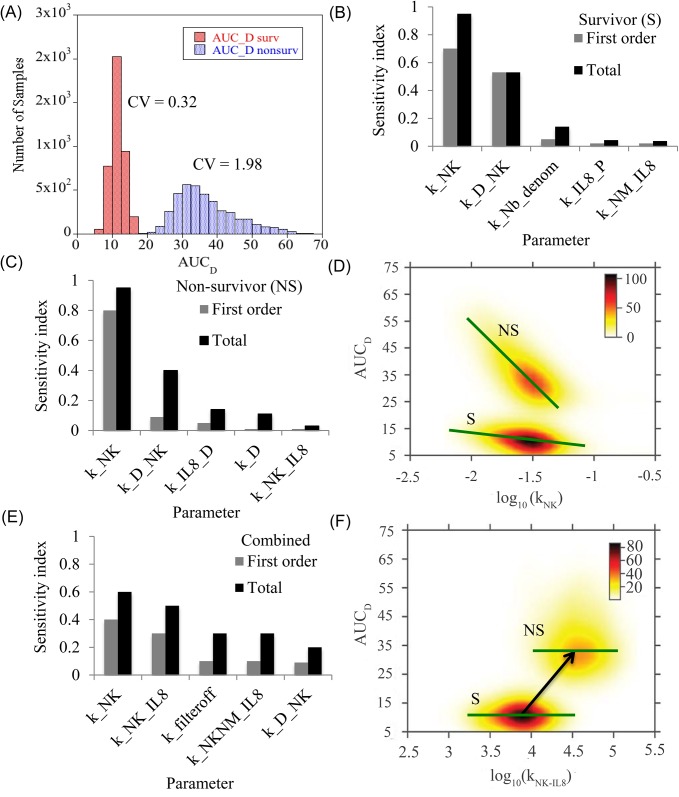
Fig 6. Factors affecting cumulative systemic damage.
(A) Cumulative damage seen in survivors and non-survivors. The histograms show the area under the damage curve until 144 hr. The rate parameters were sampled from the generated ensemble for each population. The distribution used for GSA contains 4000 samples for each population. (B-C) Prime drivers of cumulative damage. First order and total effect Sobol’ indices which explained most of the variance are tabulated here for the survivor and non-survivor population respectively. (D) Functional dependence of AUCD on killer cell decay rate for the survivors (S) and non-survivors (NS). The green line has been added for visual guidance of the trend and is based on the mean trend identified by the RS-HDMR component functions. For each population, damage decreases with increase in the decay rate of the killer neutrophil. (E) Prime drivers of cumulative damage for the combined population. (F) Functional dependence of AUCD on CXCR1 induced naïve to killer neutrophil transition rate for the survivors and non-survivors. The green line shows that within the population, damage is not particularly sensitive to the transition rate, but increased transition rate could be responsible for higher damage levels seen in non-surviving population.

