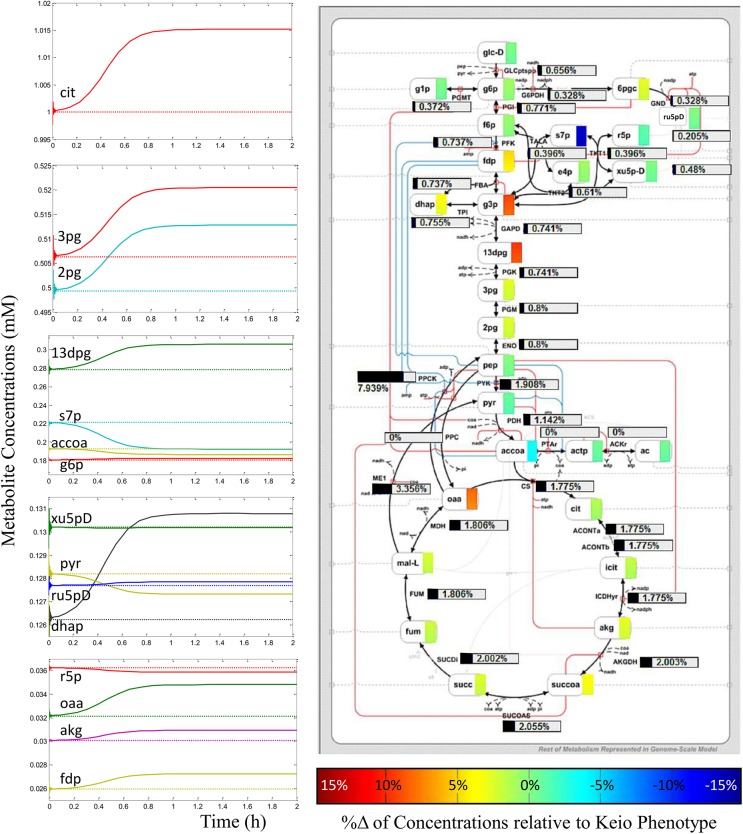
Fig 5. Plots and schematic showing metabolic profile of alternative steady state found.
Plots along left illustrate the convergence of the model metabolite concentrations (solid lines) onto a steady state different from the Keio phenotype (dotted lines). Simulations initiated randomly in the metabolic phase space always and only ever converged onto these two stable metabolic steady states. The kinetic model schematic illustrates the percentage difference in metabolite concentrations (coloured rectangles next to metabolite names) and fluxes (black horizontal bars) between the achieved alternative steady state and the Keio phenotype.

