
Fig 6. Plots of the optimized parameters determined for ICDH reaction equation.
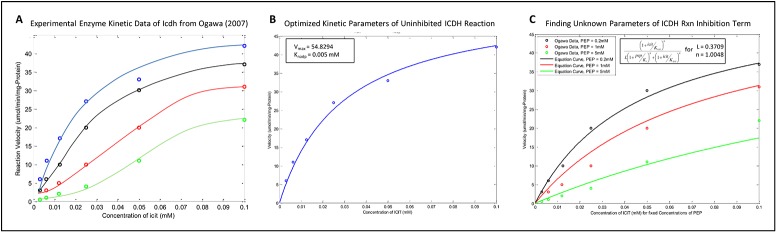
[A] Plot of the experimental measurements of Ogawa et al, (2007) (hollow circles), for different fixed concentrations of inhibitor pep ([pep] = 0mM, 0.2mM, 1mM and 5mM are given by blue, black, red and green lines respectively). The solution of the reaction equation with optimized parameters (solid respectively coloured curves) is superimposed onto the data points. The optimization resulted in a very close fit with the measured data. [B] Similar plot, but of only the fitting of the kinetics of the uninhibited reaction. [C] Similar plot, but of only the inhibiting term of the reaction equation, equation given in plot.