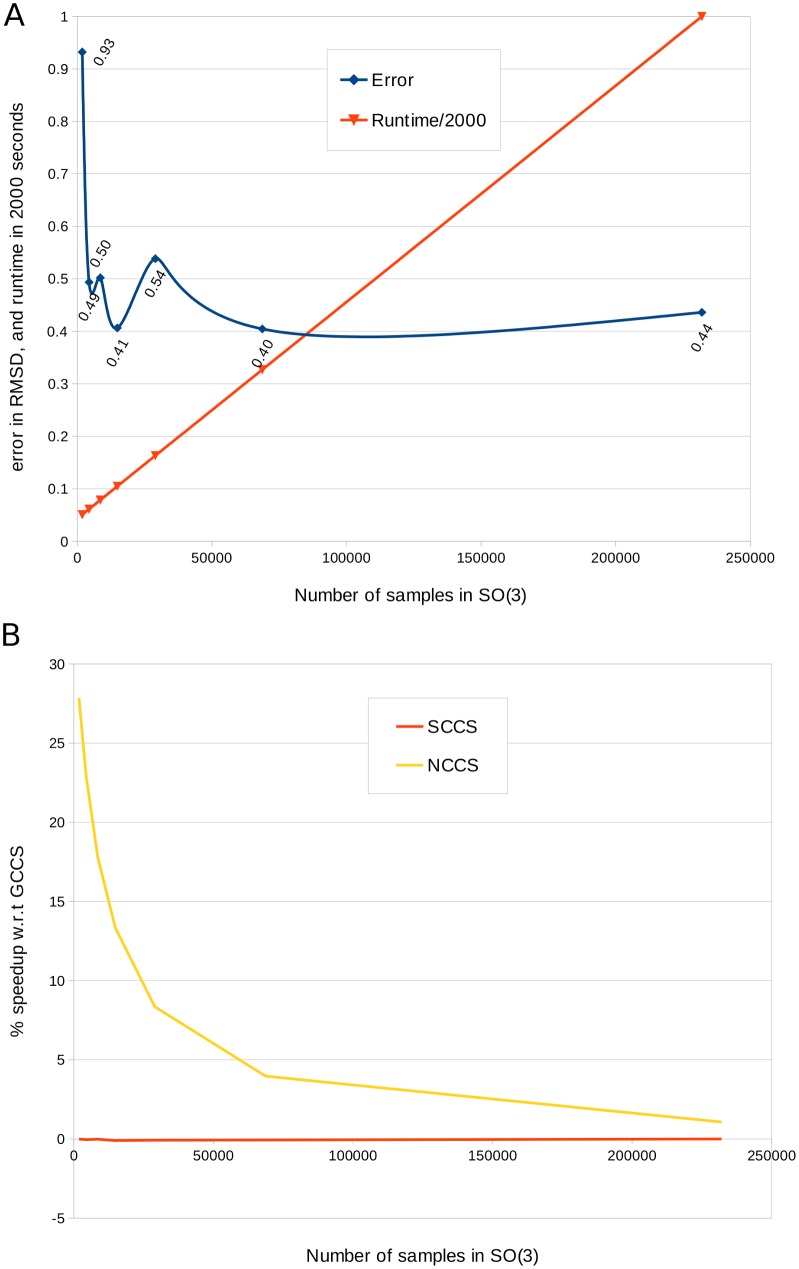
Fig 7. Speed-accuracy trade-offs in PF2 fit.
(A) The plot displays the average runtime (divided by 2000) using the GCCS scoring term, and the corresponding error (in RMSD) when PF2 fit is applied on the synthesized EM dataset. Notice that the runtime increases linearly with the number of samples in SO(3), but the average error is quite steady between 0.4 to 0.5Å except for the case when only 2000 samples were used. We believe that such robustness stems from the low discrepancy of the sampling. (B) We compared the average speeds of PF2 fit on the synthesized EM dataset with GCCS, SCCS and NCCS using the same expansion degree (L = 20). The plot shows that NCCS is faster than GCCS, specially when fewer samples are used. On the other hand SCCS is marginally slower (around 0.1%) than GCCS.

