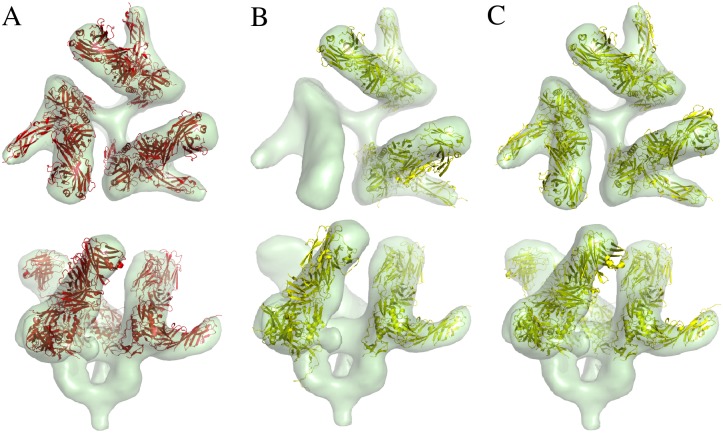
Fig 8. Comparison of PF2 fit with other software in subunit-assembly fitting.
Fitting the PDB molecule 𝓟 (1GC1) to the EM map 𝓜 of SIV 20Å(EMD5020), using the GCCS. Two different views of the molecules are given: (A) Results from PF2 fit. The ETR is 0.03. (B) Results from colores with default options. The ETR is 0.1. (C) Results from ADP_EM with L = 25. The ETR is 0.08.

