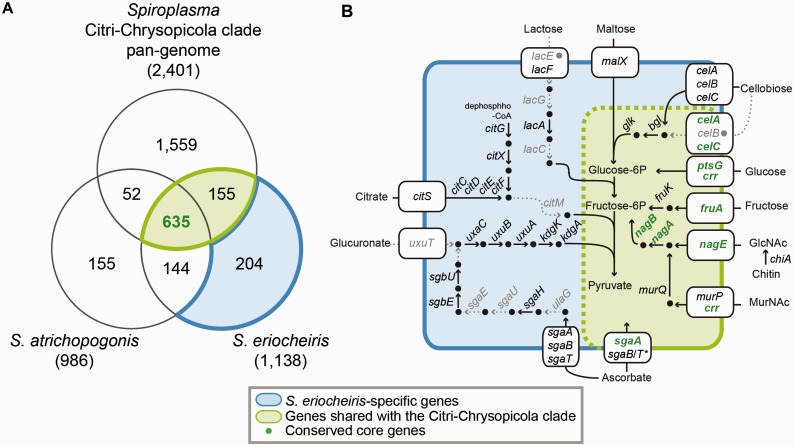
Fig. 3.—
Gene content analysis. (A) A Venn diagram showing the distribution of homologous gene clusters among S. atrichopogonis, S. eriocheiris, and the pan-genome of those Citri–Chrysopicola clade strains listed in table 1. The S. eriocheiris homologs are divided into strain-specific genes (blue; 204 clusters) and those shared with the Citri–Chrysopicola clade (green; including 635 clusters with intact homologs in S. atrichopogonis and 155 without, all of which are putatively ancestral to the Citri–Chrysopicola–Mirum clade). Other than the 635 genes clusters shared by all, most of the S. atrichopogonis genes (including the 144 clusters shared with S. eriocheiris but not the Citri-Chrysopicola clade) are hypothetical proteins and were excluded from the metabolic inference. The complete lists of genes are provided in supplementary table S2, Supplementary Material online. (B) Selected metabolic pathways of S. eriocheiris. The color scheme is based on that used in panel (A); pathway in dashed lines and gene names in gray color indicate that the corresponding genes are absent or have been pseudogenized (labeled by filled gray circles).

