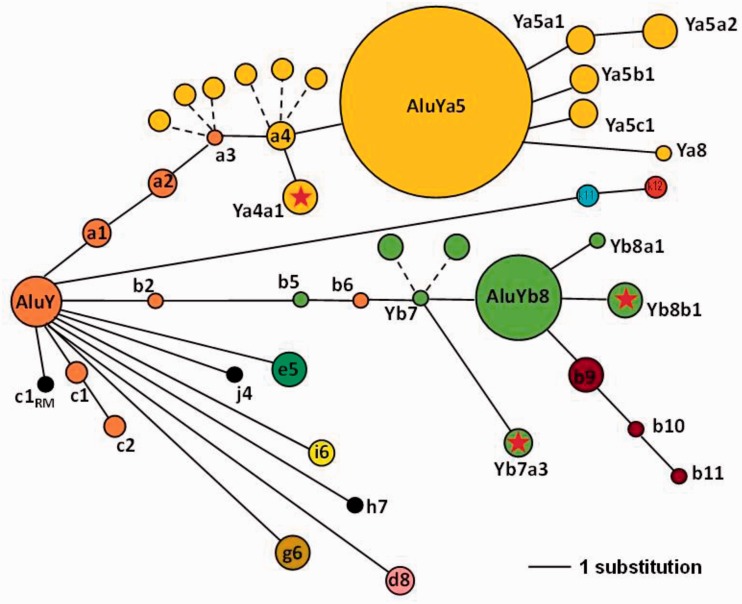
Fig. 6.—
A schematic drawing of a network diagram for the high-resolution distribution of Alu subfamilies analyzed in this study to illustrate the “bush-like” evolutionary tree. The diameter of each primary node is roughly proportional to the number of elements within the subfamily (AluY: N = 27; Yb8: N = 47 and Ya5: N = 103), whereas the smallest node equals a single element (i.e., Ya8, Yb10, Yj4, etc.). The distance between nodes represents the number of nucleotide substitutions from the most recent ancestral node (solid lines). For example, Yb7a3 is three substitution lengths from the Yb7 node. Dashed lines indicate nodes with different combinations of the same number of diagnostic variants, without an additional substitution. For example, the dashed lines branching from theYa3 and Ya4 nodes depict the Ya3.1, Ya3.3, Ya3.4 or Ya4.2, Ya4.3 and Ya4.4 elements in our data set, as defined by Shen et al. (1991) and Roy et al. (2000). The dashed lines branching from the Yb7 node depict Yb7.2 and Yb7.3 elements in our data set, as defined by Carroll et al. (2001). The AluY lineage is shown in orange, Yb8 in green, and Ya5 in yellow. The RM subscript at the base of the AluYc1 node shown in black denotes this as a RepeatMasker-defined consensus sequence, as opposed to Yc1 as defined by Roy-Engel et al. (2001) and others. A red star within the node represents the three new subfamilies discovered in this study.

