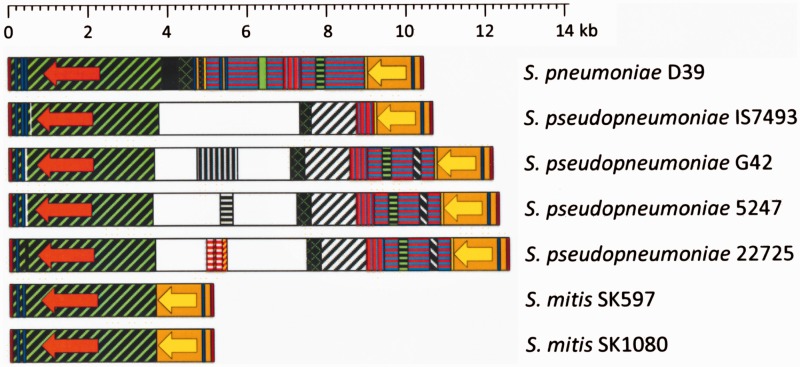
Fig. 7.—
Diagram showing the plyA−lytA islands in two species of SMG. The S. pneumoniae D39 strain is shown for comparison. Red and yellow arrows correspond to the plyA and lytA genes, respectively. The arrows indicate the direction of transcription. Regions having ≥85% sequence identity are represented by identical color and shading.

