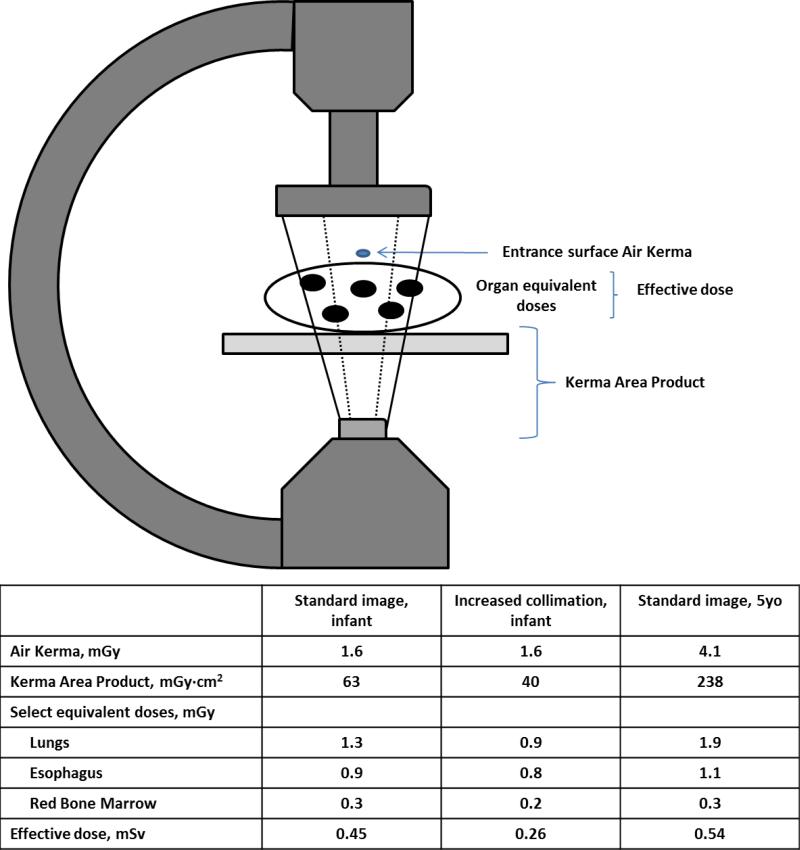
Figure 2.
A fluoroscopy example illustrating how different dose metrics may vary depending on the imaging. The doses in the table were obtained from 1 minute of fluoroscopic imaging of anthropomorphic phantoms representing a small infant and a larger child. When comparing doses in the infant using a standard (solid lines) versus more collimated (dashed lines) image, there is no difference in surface Air Kerma (a point estimate of dose). However, Kerma Area Product is reduced due to a smaller imaging field of view. Organ equivalent doses represent absorbed doses to individual organs. The esophagus dose has not changed substantially because it is in the center of the imaging field of view and is less affected by peripheral collimation. However, lung doses are reduced by 30% due to restricted field of view. Effective dose is more significantly reduced because lungs are high sensitivity organs more heavily weighted in effective dose calculations. In the older phantom, increased body mass requires higher emitted doses (Air Kerma and Kerma Area Product). However increased tissue attenuation limits organ absorption and effective dose is only marginally higher.

