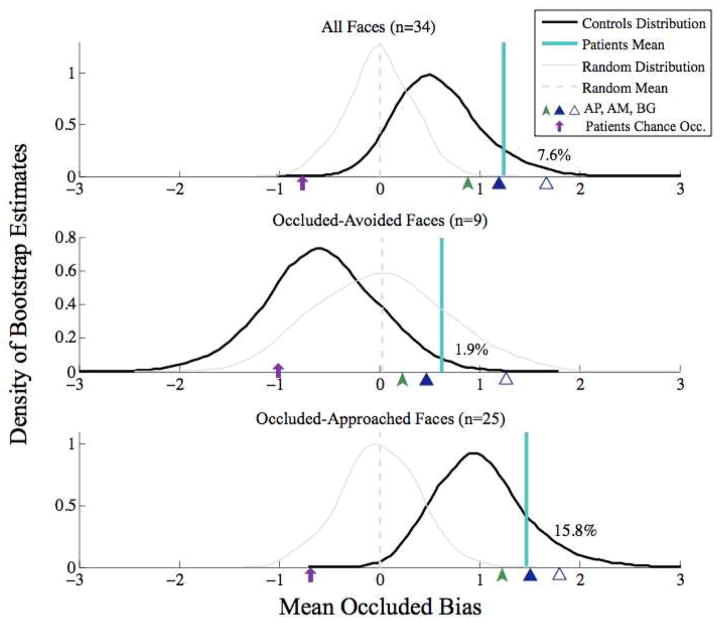
Figure 3.
Mean patient occluded bias scores compared to bootstrapped mean control bias scores. Density plot estimates (black) of the bootstrap distribution of three randomly-sampled controls’ mean occluded-bias scores for all faces (top), “occluded-avoided” faces as classified by control ratings (middle), and “occluded approached” faces (bottom), with the three patients’ actual mean bias score overlaid in teal and the individual patients’ mean scores indicated by green and blue arrows on the x-axis. To remove statistical dependency between our classification of “occluded-avoided” and “occluded-approached” faces and our comparison of 3 randomly sampled controls to the patients, for each bootstrap iteration, occluded-avoided and occluded-approached faces were classified according to the 78 remaining controls. Percent of bootstrap control estimates with a higher occluded bias rating is indicated on each plot, demonstrating that patients’ occluded-approach bias scores tended to be higher than controls’ scores. To test against these reported effects being driven by regression to the mean, bootstrapped estimates of 3 patients with random bias scores (built from raw trust and threat scores evenly distributed from 1 to 6) are overlaid in gray with their mean value overlaid in a pale blue dashed line. Demonstrating that the patients’ deviation from controls was driven by their occluded ratings, an average synthetic patient bias rating given their actual whole face scores and chance occluded scores is indicated on each plot with a purple arrow.

