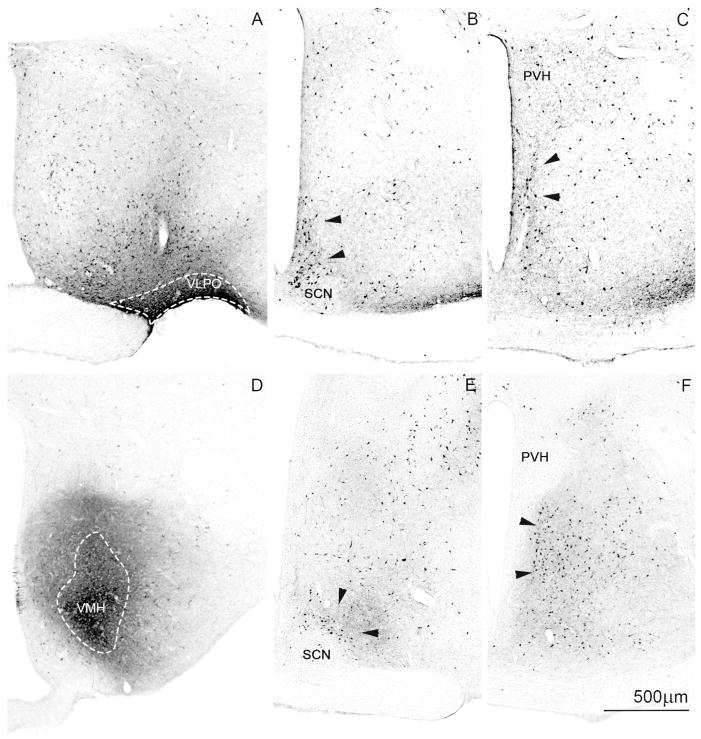
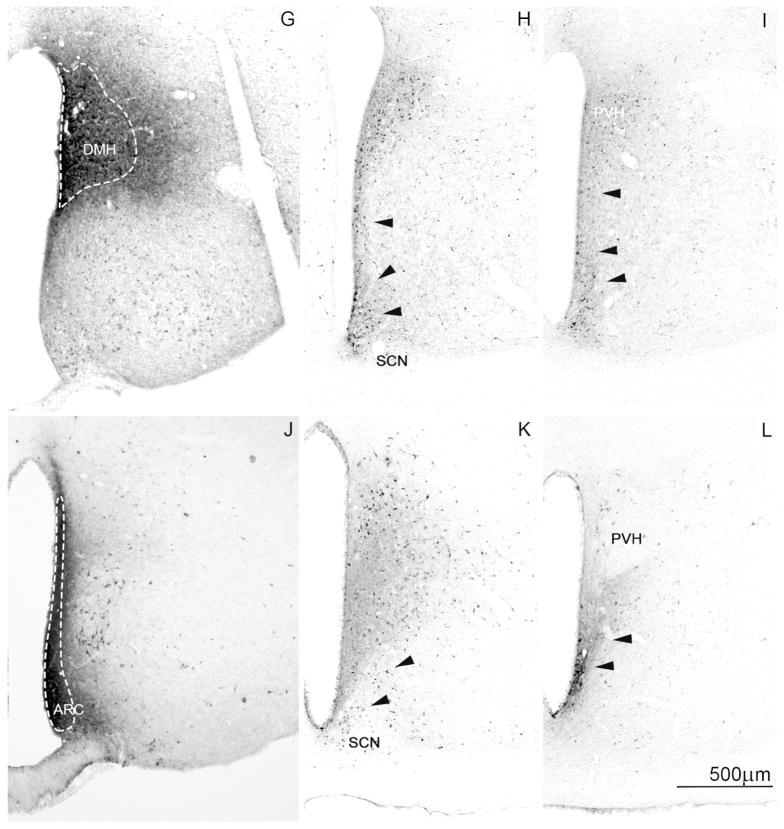
Figure 7.
Brightfield photomicrographs showing injection sites (A,D,G,J) and retrogradely labeled cells at the level of the vSPZ (B,E,H,K) and dSPZ (C,F,H,L) following CTb injection into the (A–C) ventrolateral preoptic nucleus (case R2059), (D–F) ventromedial hypothalamic nucleus (case NVA151), (G–I) dorsomedial hypothalamic nucleus (case 1927), and (J–L) arcuate nucleus (case NVA150). White dotted lines designate the CTb injection core and black arrowheads designate clusters of retrogradely labeled cells in the SPZ.


