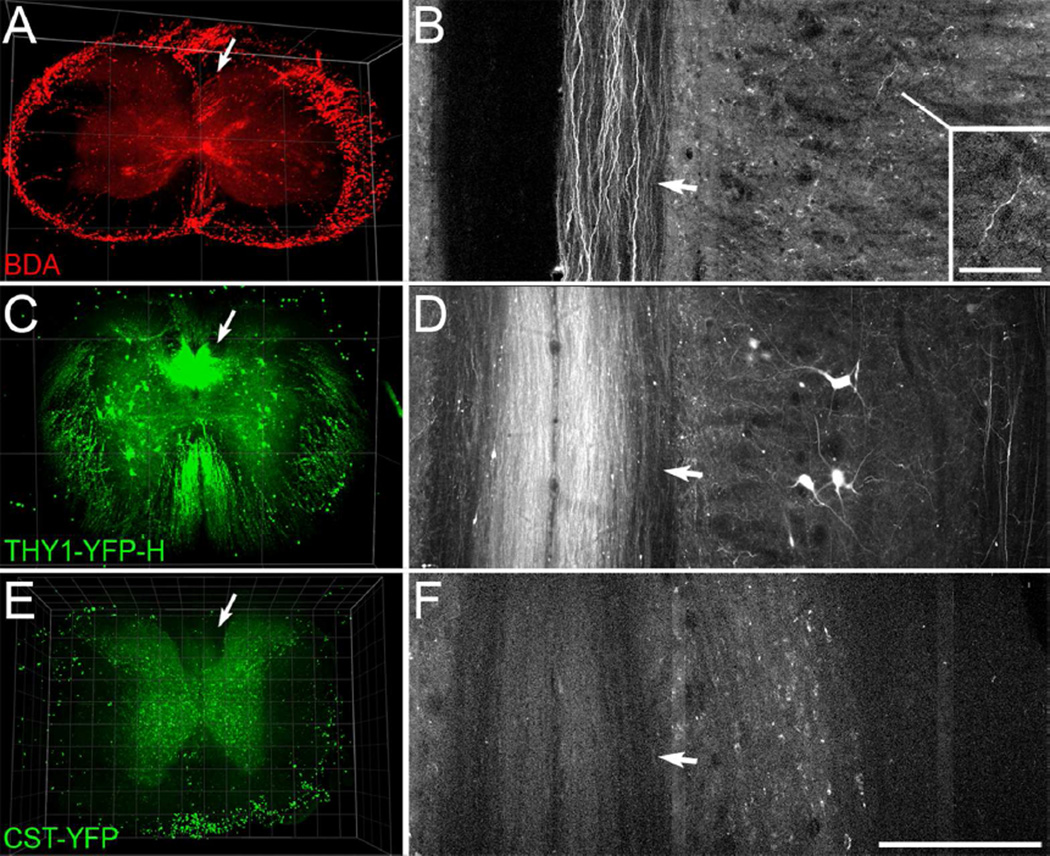
Figure 6.
3D imaging of cleared blocks of spinal cord from a mouse with BDA-labeled CST axons, a Thy1-YFP-H mouse, and a CST-YFP mouse. A-B, A 3D view through 482 µm of cervical spinal cord (A) and horizontal projection through 6µm of the dorsal column (B) show visible BDA-labeled axons in the dorsal CST (arrows), rostral to a spinal cord injury. This tissue is from a Ptenfl/fl mouse that had received cortical injections of AAV-Cre and mini-ruby BDA injections into the left cortex. Note the visible individual axons in horizontal projection in the dorsal column (arrow, B), and in the grey matter (inset, B). C-D, A 3D view through 450 µm of spinal cord (C) and 6 µm horizontal projection in the dorsal column (D) from a hemizygous Thy1-YFP H mouse. Note the strong signal intensity of axons in the dorsal column (arrows) as well as individual axons distributed through the spinal cord. E-F, A 3D view through 400 µm of a block of thoracic spinal cord (E) and 6 µm horizontal projection though the dorsal column (F) from a CST-YFP mouse. Note that the signal from axons in the dorsal column (arrows) is lower than that of the grey matter background. Scan settings were the same as for the block of spinal cord from the Thy1-YFP-H mouse shown in C-D. Fluorescence of the outer rim in A and ventral rim in E is artifact presumably from remaining sub-dural vasculature. Laser excitation was 850 nm for the specimen with BDA (A-B), and 950 nm for the CST-YFP and Thy1-YFP-H mouse (C-F). Grid spacing, 500 µm (A, C), 100 µm (E). Scale bar, 200 µm (B, D, F), 50 µm (B, inset).

