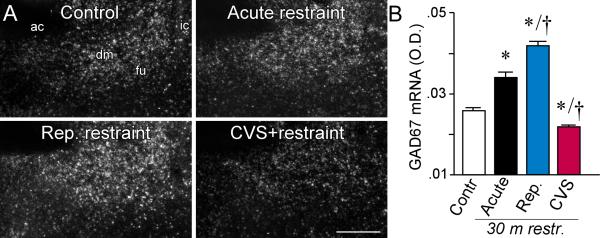
Figure 6.
A: Representative darkfield photomicrographs show GAD 67 mRNA expression in aBST in all four treatment groups. ac, anterior commissure; dm dorsomedial subdivision; fu, fusiform subdivision; sc, subcommissural subdivision. B: Mean + SEM relative optical densities for GAD67 mRNA in aBST of treatment groups. Whereas acute stress elevated, repeated restraint produced further enhancements in, GAD expression in aBST. Conversely, GAD expression was significantly decreased following CVS compared to all other treatment groups. *, p < 0.05, differs significantly from unstressed controls; †, p < 0.05, differs significantly from the acute stress group. N = 4 control, acute, and repeated groups; N = 5 CVS. Scale bar: 150 μm (applies to all).

