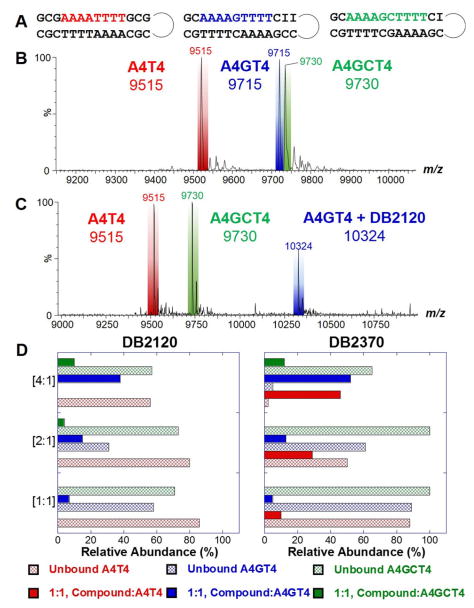
Figure 3.
(A) Sequences used for competition ESI mass spectrometry. Example spectra of (B) free DNA and (C) DNA and DB2120-DNA complexes. (D) Comparison of the peak intensities for DNA and ligand-DNA complexes for a series of titrations of [1:1], [2:1], and [4:1] and are expressed as a mole to mole ratio of ligand to DNAsingle sequence (e.g. [2:1] = 10 μM DB2120 to 5 μM A4T4).

