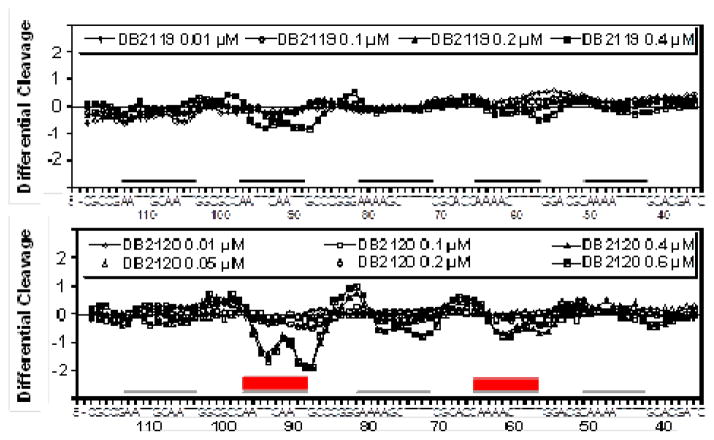
Figure 4.
DNase I footprinting densitometry analysis. Binding of the phenyl (DB2119) and pyridyl (DB2120) compounds to the 3′-end radio-labeled 208bp DNA fragment (experimental details in Supplementary material) containing the five different DNA sequences (A4CT4•A4GT4, A4T4•A4T4, A4GCT4•A4GCT4, AATTCAATT•AATTGAATT, and AATTGCAATT•AATTGCAATT, localized as black lines) was quantified relative to unbound DNA treated with DNase I in similar manner. The primary bound portions of DNA are localized as red boxes. The single G•C bp recognition by the pyridyl compound is visually apparent

