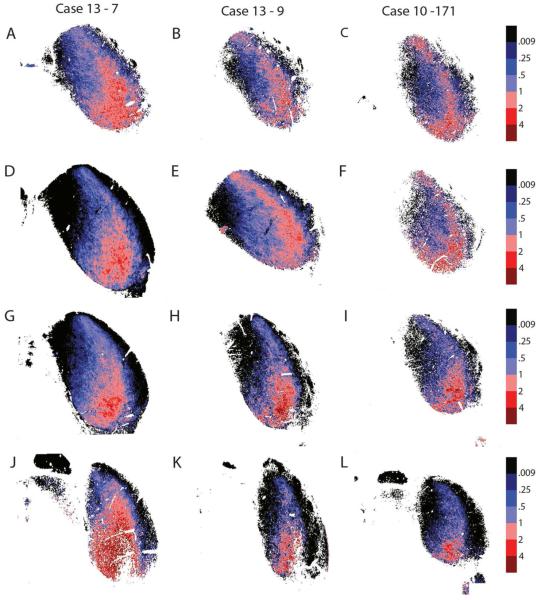
Figure 3.
Ratiometric analysis of sections shown in Figure 2 showing GLY-rich areas ventrolaterally and GABA-rich areas dorsomedially across different rostrocaudal levels in the rat. Section order and orientation same as Fig. 2. The same basic pattern is seen on these heat maps as in Fig. 1; GLY-rich areas are ventro-lateral and blue GABA-rich areas found dorsomedial. Red = >1.0; blue = <1.0.

