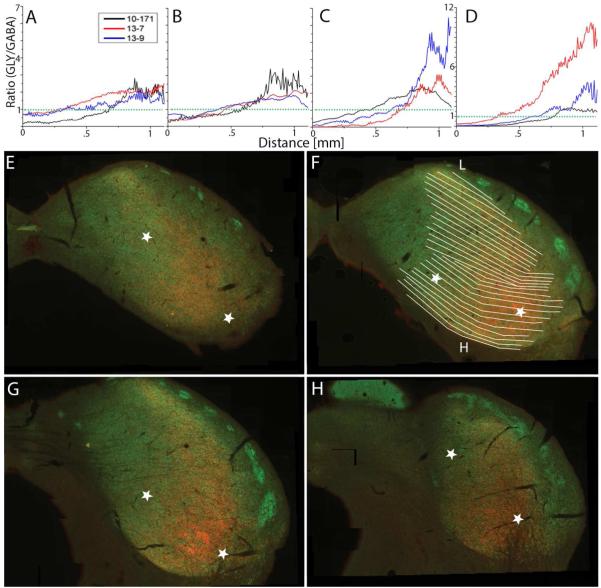
Figure 4.
Rate of ratiometric change parallel to layers in ICC within the same section. A-D, line histograms parallel to the lamina to show the changing ratio data between GABA-rich areas and GLY-rich areas for three rats shown in Figs. 2-3. Green dotted line represents GABA and GLY ratio = 1.00. E-H, shows location of the endpoints of lines used in A-D with the data reading from the left star to the right star (GABA-rich and GLY-rich, respectively). E-H shows images from one case, but the other cases were analyzed in similar areas. F has fibro-dendritic lamina defined with the tonotopic axis along the L and H corresponding to low and high frequency areas, respectively.

