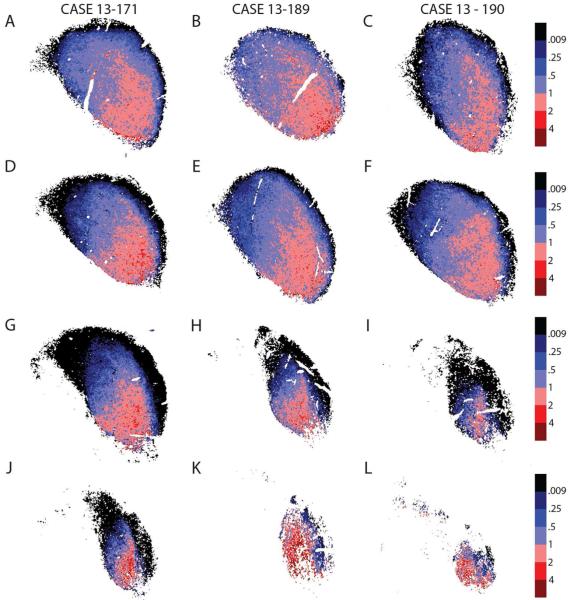
Figure 7.
Ratiometric analysis GLY/GABA for mouse sections in Fig. 6. with glycine rich areas ventrolaterally and GABA rich areas dorsomedially across different sections. Image is the mouse counterpart for Fig. 3 of rat. Less GLY-rich areas are seen dorsolaterally compared to the rat. Red = >1.0; blue = <1.0.

