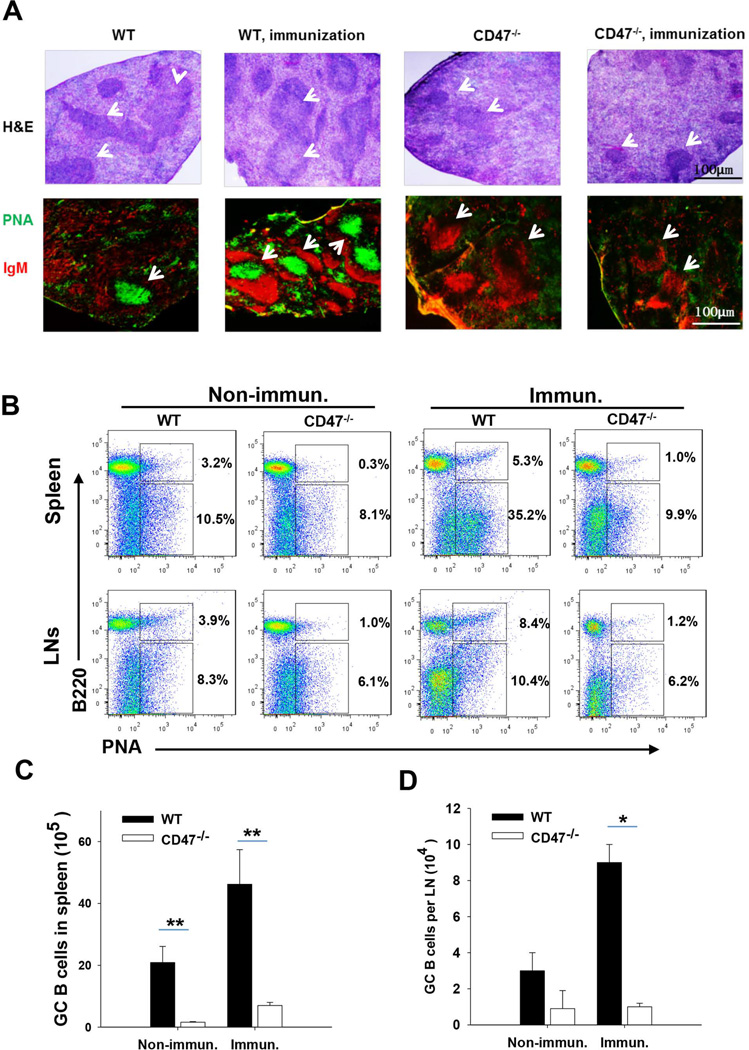
Figure 4.
Impairment of GC formation and reaction in immunized CD47−/− mice. A) Sections of spleen white pulp were stained with anti-IgM mAbs (red) and peanut agglutinin (PNA; green) to show GC architecture. B) Flow cytometry data displaying the frequency of GC B cells in spleen and lymph nodes in WT and CD47−/− mice (n=5). Cells were stained with FITC-PNA and PE-B220 mAb. C–D) The numbers of GC B cells in the spleen (C) and lymph nodes (D) from immunized WT and CD47−/− mice. *, P<0.05; **, P<0.01.

