
Figure 6.
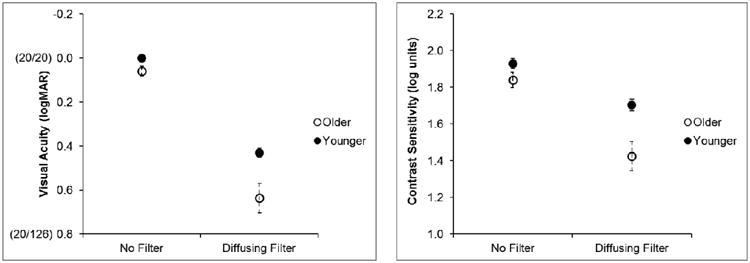
Mean visual acuity (left panel) and contrast sensitivity (right panel) of the subjec in the older and younger groups without and with the diffusing filters. Values in parenthes on the y-axis on the left panel are Snellen acuities. Error bars represent standard errors of the mean.