
Figure 5.
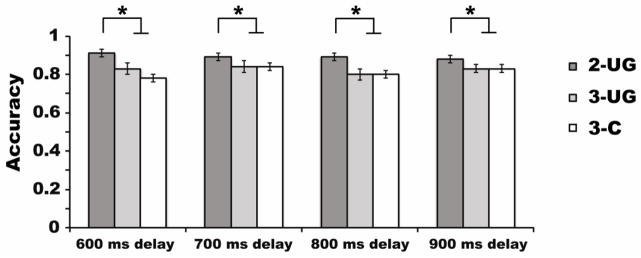
Behavioral results from Experiment 2b. The abscissa depicts the delay period intervals used in the experiment. The legend shows the stimulus conditions. Accuracy is plotted along the ordinate by showing the proportion of correct trials. Asterisks and lines above the bars in the figure symbolize an observed significant difference between the two-item condition and each of the three-item conditions at each delay period interval; α = p < 0.05. Error bars represent the standard errors of the means.