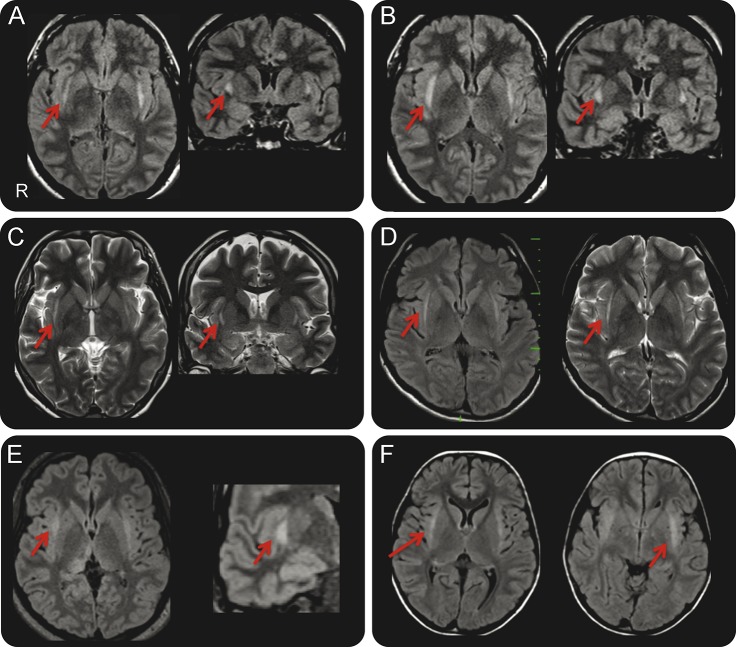
Figure 1. Claustrum sign.
(A, B) Axial and coronal fluid-attenuated inversion recovery (FLAIR) images show claustrum hyperintensity (red arrows) during the status epilepticus (SE) in patients 1 and 2, 10 and 4 days from onset, respectively. (C) Axial and coronal T2 images show claustrum hyperintensity (red arrows) during the SE in patient 3, 3 days from onset. (D) Axial FLAIR and axial T2 images show claustrum hyperintensity (red arrows) during the SE in patient 4, 9 days from onset. (E) Axial FLAIR images acquired during SE (left image) and coronal detail (right image) of claustrum hyperintensity in patient 5 (red arrows); note also the posterior thalamus hyperintensity (the patient also experienced visual seizures). (F) Axial FLAIR images show claustrum hyperintensity (red arrows) during the SE in patient 6, 7 days from onset.

