
Figure 2. Boxplots of internodal length in each Charcot-Marie-Tooth genotype and controls.
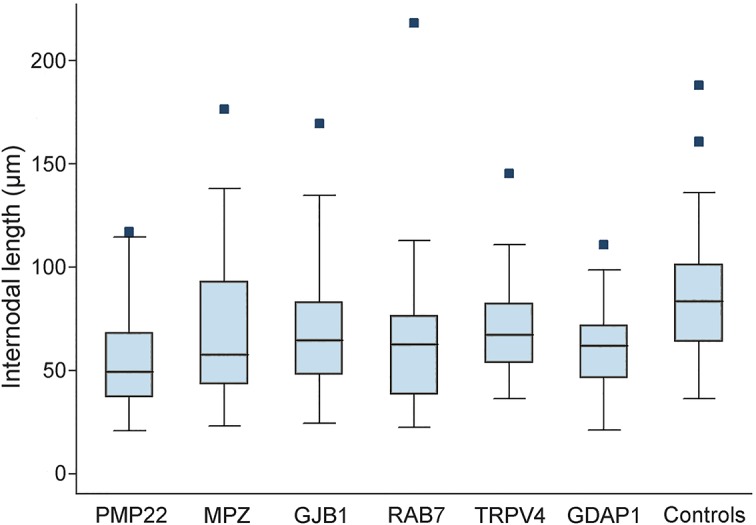
Dark horizontal lines represent the median value, with the box representing the 25th and 75th percentiles, the whiskers the lower and upper adjacent values, and outside values represented by dots.