Figure 1.
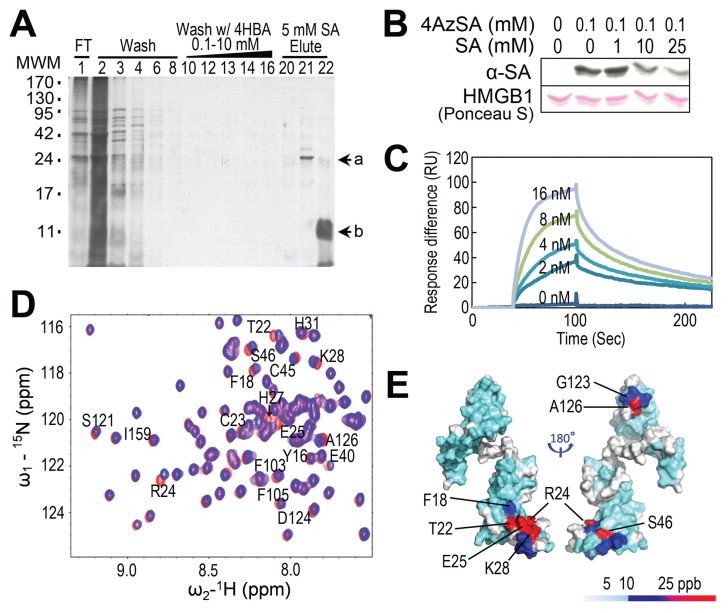
Identification of HMGB1 as an SA-binding protein and its SA-binding sites. (A) Affinity purification of SABPs from human HeLa cells. Total protein extracts prepared from human HeLa cells were chromatographed on an SA-immobilized PharmaLink column. After washing with increasing concentrations of the biologically inactive SA analog, 4-hydroxy benzoic acid (4-HBA), the retained proteins were eluted with 5 mmol/L SA, fractionated by gel electrophoresis and resolved by silver staining. Subsequent MS analyses identified band a as HMGB1 (GI: 4504425). Note that the band denoted by “b” was identified as soybean trypsin inhibitor, added to inhibit protein degradation. MWM, molecular weight markers. (B) Photoaffinity labeling of HMGB1 using 4AzSA. HMGB1 was incubated with or without 0.1 mmol/L 4AzSA in the absence or presence of the indicated concentrations of SA for 1 h, and then treated with UV light (50 mJ). Proteins labeled with 4AzSA were detected by immunoblot analysis with α-SA antibodies. Proteins stained with Ponceau S served as a loading control. (C) HMGB1 has strong affinity for 3AESA with an apparent Kd of 1.48 nmol/L. Sensorgrams of concentration-dependent HMGB1 interacting with 3AESA immobilized on the SPR sensor chip. (D and E) Identification of SA binding sites on HMGB1. (D) 15N-1H-HSQC spectra for HMGB1-ΔC were generated in the presence (blue) or absence (red) of 10 mmol/L SA; expanded regions of the spectra were then superimposed. Residues that show significant chemical shift perturbations (CSPs) due to SA binding are labeled. (E) SA-induced CSPs mapped onto the 3D structure of human HMGB1-ΔC (PDB id: 2YRQ, residues 6–164). The colors in the space-filling model correspond to the amplitude of the observed CSPs [cyan: Δδ(N–H) < 12 ppb; blue: 12 < Δδ(N–H) < 25 ppb; red: Δδ(N–H) > 25 ppb, as indicated by the scale]. Residues for which the backbone 15N-1H resonance assignments are not available due to rapid exchange of surface amide protons and/or proline residues are shown in white.

