Figure 2.
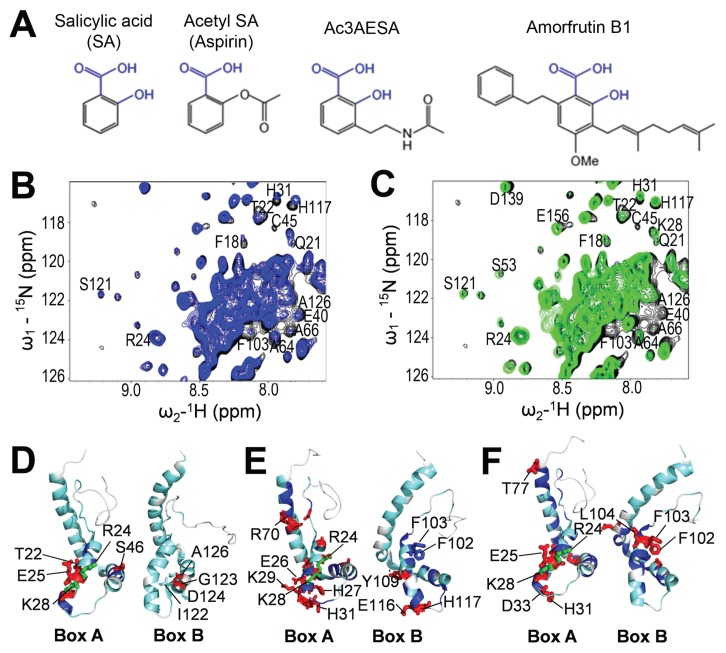
Ac3AESA and amorfrutin B1 bind in the SA-binding sites of HMGB1. (A) Chemical structures of SA and its synthetic and natural derivatives. Conserved hydroxyl (-OH) and carboxyl (-COOH) groups of salicylates are shown in blue. (B and C) 2D 15N-1H HSQC spectra for full-length (FL) HMGB1. Spectra were recorded in the absence (black) or presence of 3 mmol/L ac3AESA (blue) (B) or 2 mmol/L amorfrutin B1 (green) (C). Expanded regions of the spectra were then superimposed. Residues that show significant CSPs due to ligand binding are labeled. (D–F) 15N-1H Δδ(N–H) CSPs due to SA (D), ac3AESA (E), and amorfrutin B1 (F) binding are mapped onto the 3D structure of human HMGB1 (PDB id: 2YRQ, residues 6–164), which is oriented to highlight the similarities and differences in the SA-binding sites of Box A and Box B. The colors correspond to the amplitude of the observed CSPs [cyan: Δδ(N–H) < 12 ppb; blue: 12 < Δδ(N–H) < 25 ppb; red: Δδ(N–H) > 25 ppb]; residues that both exhibit significant Δδ(N–H) CSPs and were mutated to Ala are shown in green.

